How to read a dividend yield without getting fooled
What dividend yield really measures, why a 12% yield is often a warning sign, and how payout ratio and the ex-dividend date fill in the picture.
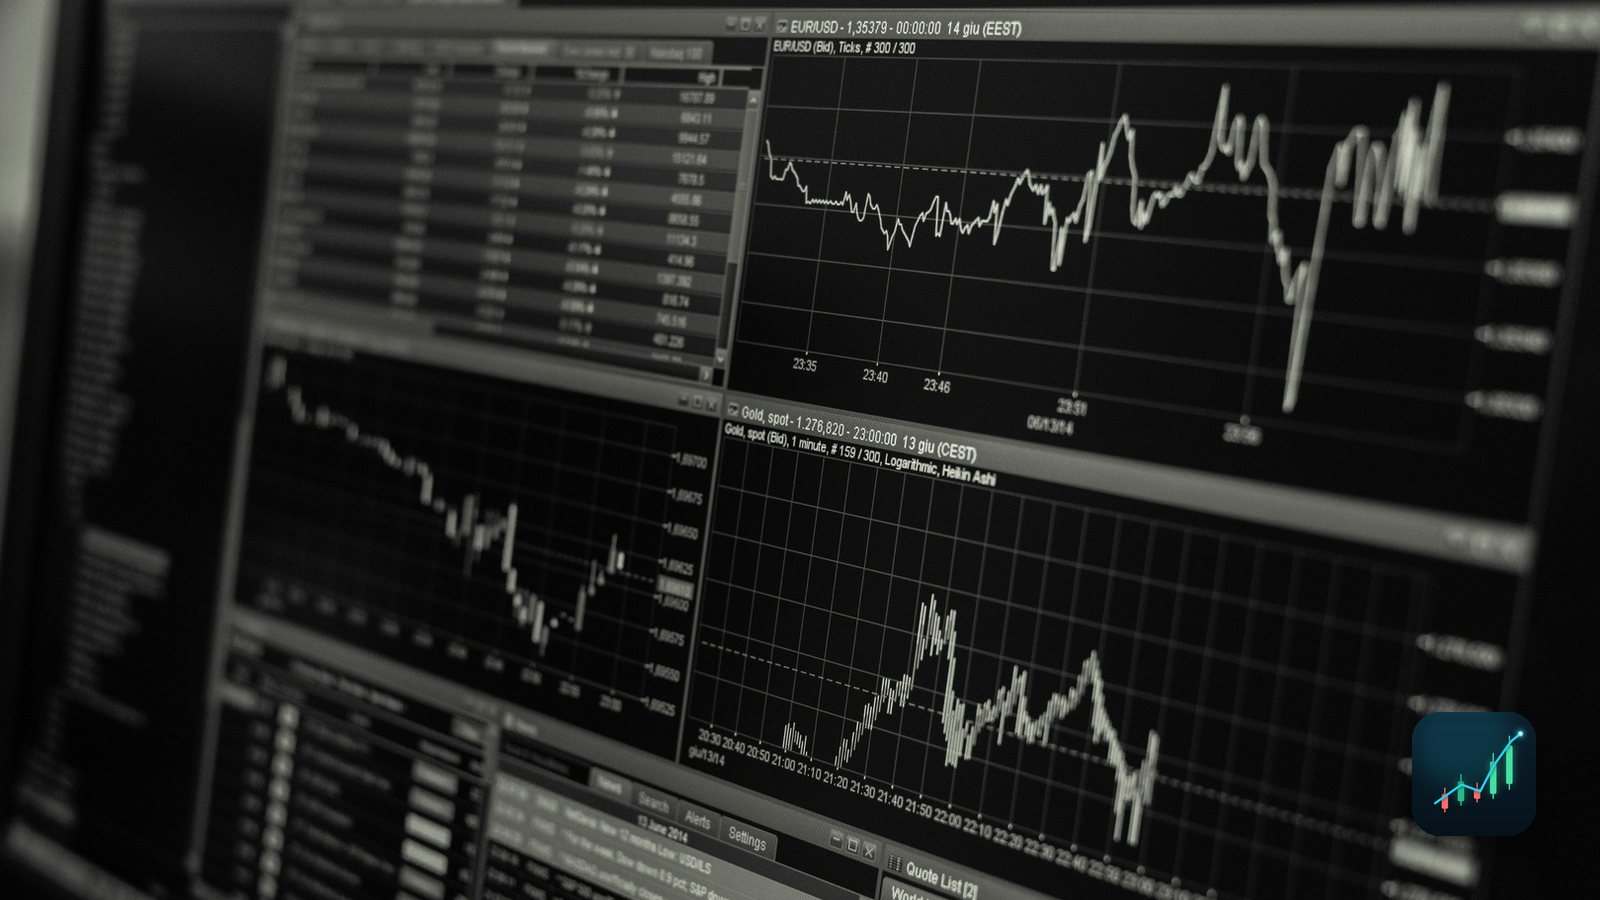
A stock screener shows two companies side by side. One yields 2.5%, the other 11%. The second looks like it pays four times as much for the same money, and that's the trap. A yield that high usually isn't a gift. It's the market telling you it doesn't believe the dividend will last.
What the yield actually measures
Dividend yield is the yearly dividend divided by today's share price.
- A stock at $50 paying $2.00 a year yields 4% ($2 ÷ $50).
- Most screeners use either the trailing yield (the last 12 months of dividends) or the forward yield (the latest payment times the number paid per year). Check which one you're looking at, because they can differ a lot after a cut or a raise.
Notice what's in the denominator. The yield can rise for two very different reasons: the company raised its dividend, or the share price fell.
Why a sky-high yield is often a warning
Take that $50 stock paying $2.00. Bad news hits and the price drops to $20. The dividend hasn't changed yet, so the yield on the screen jumps to 10%. Nothing got better. Investors simply expect the payout to be cut, and the price already reflects it. If the company then halves the dividend to $1.00, the yield falls back to 5% on a stock that lost 60% of its value.
A high yield is a question, not an answer.
Some sectors, like utilities and real estate trusts, normally run higher yields, so compare a stock with its own history and its peers, not with the whole market. A yield far above both deserves a closer look.
Three numbers that tell you more than the yield
- Payout ratio. Dividends per share divided by earnings per share. A company earning $4 and paying $2 has a 50% payout ratio and room to absorb a bad year. One paying out more than 100% of earnings is funding the dividend from somewhere else, such as cash reserves or debt. Because earnings can be noisy, many investors also compare dividends with free cash flow.
- Dividend history. Look at the last five to ten years. Steady or rising payments through a recession say more than any single yield figure. A recent cut, or a "special" one-time dividend inflating the trailing number, changes the story.
- The ex-dividend date. To receive a dividend, you must own the shares before the ex-dividend date. Since US stocks moved to one-day (T+1) settlement in May 2024, the ex-date is usually the same business day as the record date, so buying on the ex-date is too late. Also expect the share price to drop by roughly the dividend amount that morning; buying just to "catch" a dividend rarely comes out ahead.
Where do you find these? The company's annual report (10-K) and quarterly reports (10-Q), filed with the SEC, show earnings, cash flow and dividends paid. Its earnings releases often mention dividend decisions, which is why it helps to know how to read an earnings report in ten minutes. The SEC's Investor.gov site has plain-language explainers on dividends and yield.
When a company's yield looks interesting, Wall Street Friend helps with the homework around it. Search the ticker to see its earnings calendar and how the price moved after past earnings reports, and browse its 10-K, 10-Q and 8-K filings right from your iPhone. It's free, with no subscription, and it's built for research and education, not investment advice.
This is educational, not a recommendation to buy or sell anything. Learn to read yield as a ratio with two moving parts, and the next eye-popping number on a screener will make you curious instead of excited.
Related posts
-
How-to
How to read a company's earnings report in ten minutes
Oct 06, 2026
-
Product
How Wall Street Friend reads a stock's earnings history
Sep 10, 2026
-
How-to
How to read an Explanation of Benefits before you pay a bill
Sep 19, 2026
Recent posts
-
How-to
How to host a Halloween game night for adults
Oct 24, 2026
-
How-to
How to cut truck detention time at your dock
Oct 23, 2026
-
How-to
How to save money on prescriptions
Oct 22, 2026
-
How-to
How to cook a week of dinners from one grocery run
Oct 21, 2026
-
AI & Trends
How to tell when an AI answer is wrong
Oct 21, 2026
-
How-to
How to learn a trade as an adult (electrician, plumber, HVAC, welding)
Oct 20, 2026
0 comments
No comments yet — be the first.
Leave a reply
Sign in with Google to join the conversation. We require a quick sign-in to keep comments spam-free.
Sign in with Google to comment