Meet TrendVial — Longevity blood panel trends, offline
Your lab report says "normal." Your longevity goals say otherwise.

Health And Fitness
TrendVial
Longevity blood panel trends, offline
Every feature, from the first launch.
No account, no login, no cloud. Everything runs on your device and works fully offline — nothing in this post is hidden behind a wall.
What TrendVial does
Your lab report says "normal." Your longevity goals say otherwise. TrendVial is the offline timeline for the people tracking ApoB, Lp(a), HbA1c, fasting insulin, hsCRP and the rest of the modern longevity panel draw after draw, year after year.
Most lab portals show you one result at a time and grade it against a population-wide "reference range" — a band that only tells you whether you're unusual, not whether you're optimal. TrendVial flips that. Enter the markers from each blood draw and the app plots every value on a clean longitudinal chart, side by side with two bands: the standard lab reference range and the stricter optimal-for-longevity band that clinicians like Peter Attia and the 2026 dyslipidemia guidance increasingly point to. In one glance you see whether your ApoB drifted from 95 to 78 after six months of diet changes, or whether your hsCRP is quietly creeping the wrong way.
Because biomarkers only mean something in motion, TrendVial adds direction-of-travel notes: a small up or down arrow on every marker, the change since your last draw, and a plain-language reminder of which way you want it heading. A single high reading rarely matters; a slope over four draws does. This is literacy, not diagnosis — the app never tells you what to do, never flags you as sick, and never replaces your physician. It simply makes your own numbers legible so your next conversation with your doctor is sharper and your interventions are something you can actually measure.
The optimal bands aren't one-size-fits-all. Set your age and risk context once during onboarding and the longevity-optimal target for ApoB and friends adjusts accordingly — the band a healthy 38-year-old aims for is not the band a 62-year-old with cardiovascular history aims for, and TrendVial reflects that. The standard reference band stays visible alongside it so you always have both frames at once.
Everything is on-device. There's no login, no portal scraping, no data broker in the middle. You can log a draw in under a minute, attach the lab name, and revisit it offline on a plane. Mark a draw as fasted, tag an intervention (started rosuvastatin, cut refined carbs), and watch how the line bends around it.
TrendVial covers the markers the longevity world actually orders — ApoB, Lp(a), LDL-C, HDL-C, triglycerides, HbA1c, fasting glucose and insulin, hsCRP, ALT, eGFR, and a custom slot for anything else your panel includes. Add your age and risk context once and the optimal bands adjust to you.
If labread explained a single result and cuffbook tracked your blood pressure, TrendVial is the piece that's been missing: the long-game artifact that holds your whole panel across the years.
• Longitudinal chart for every marker, draw after draw • Standard reference range AND optimal-for-longevity band, side by side • Direction-of-travel arrows and change-since-last-draw • Curated marker library: ApoB, Lp(a), HbA1c, insulin, hsCRP and more • Age- and risk-aware optimal bands • Tag fasted draws and interventions to read the inflections • 100% offline, no account, no subscription, no cloud
A look inside
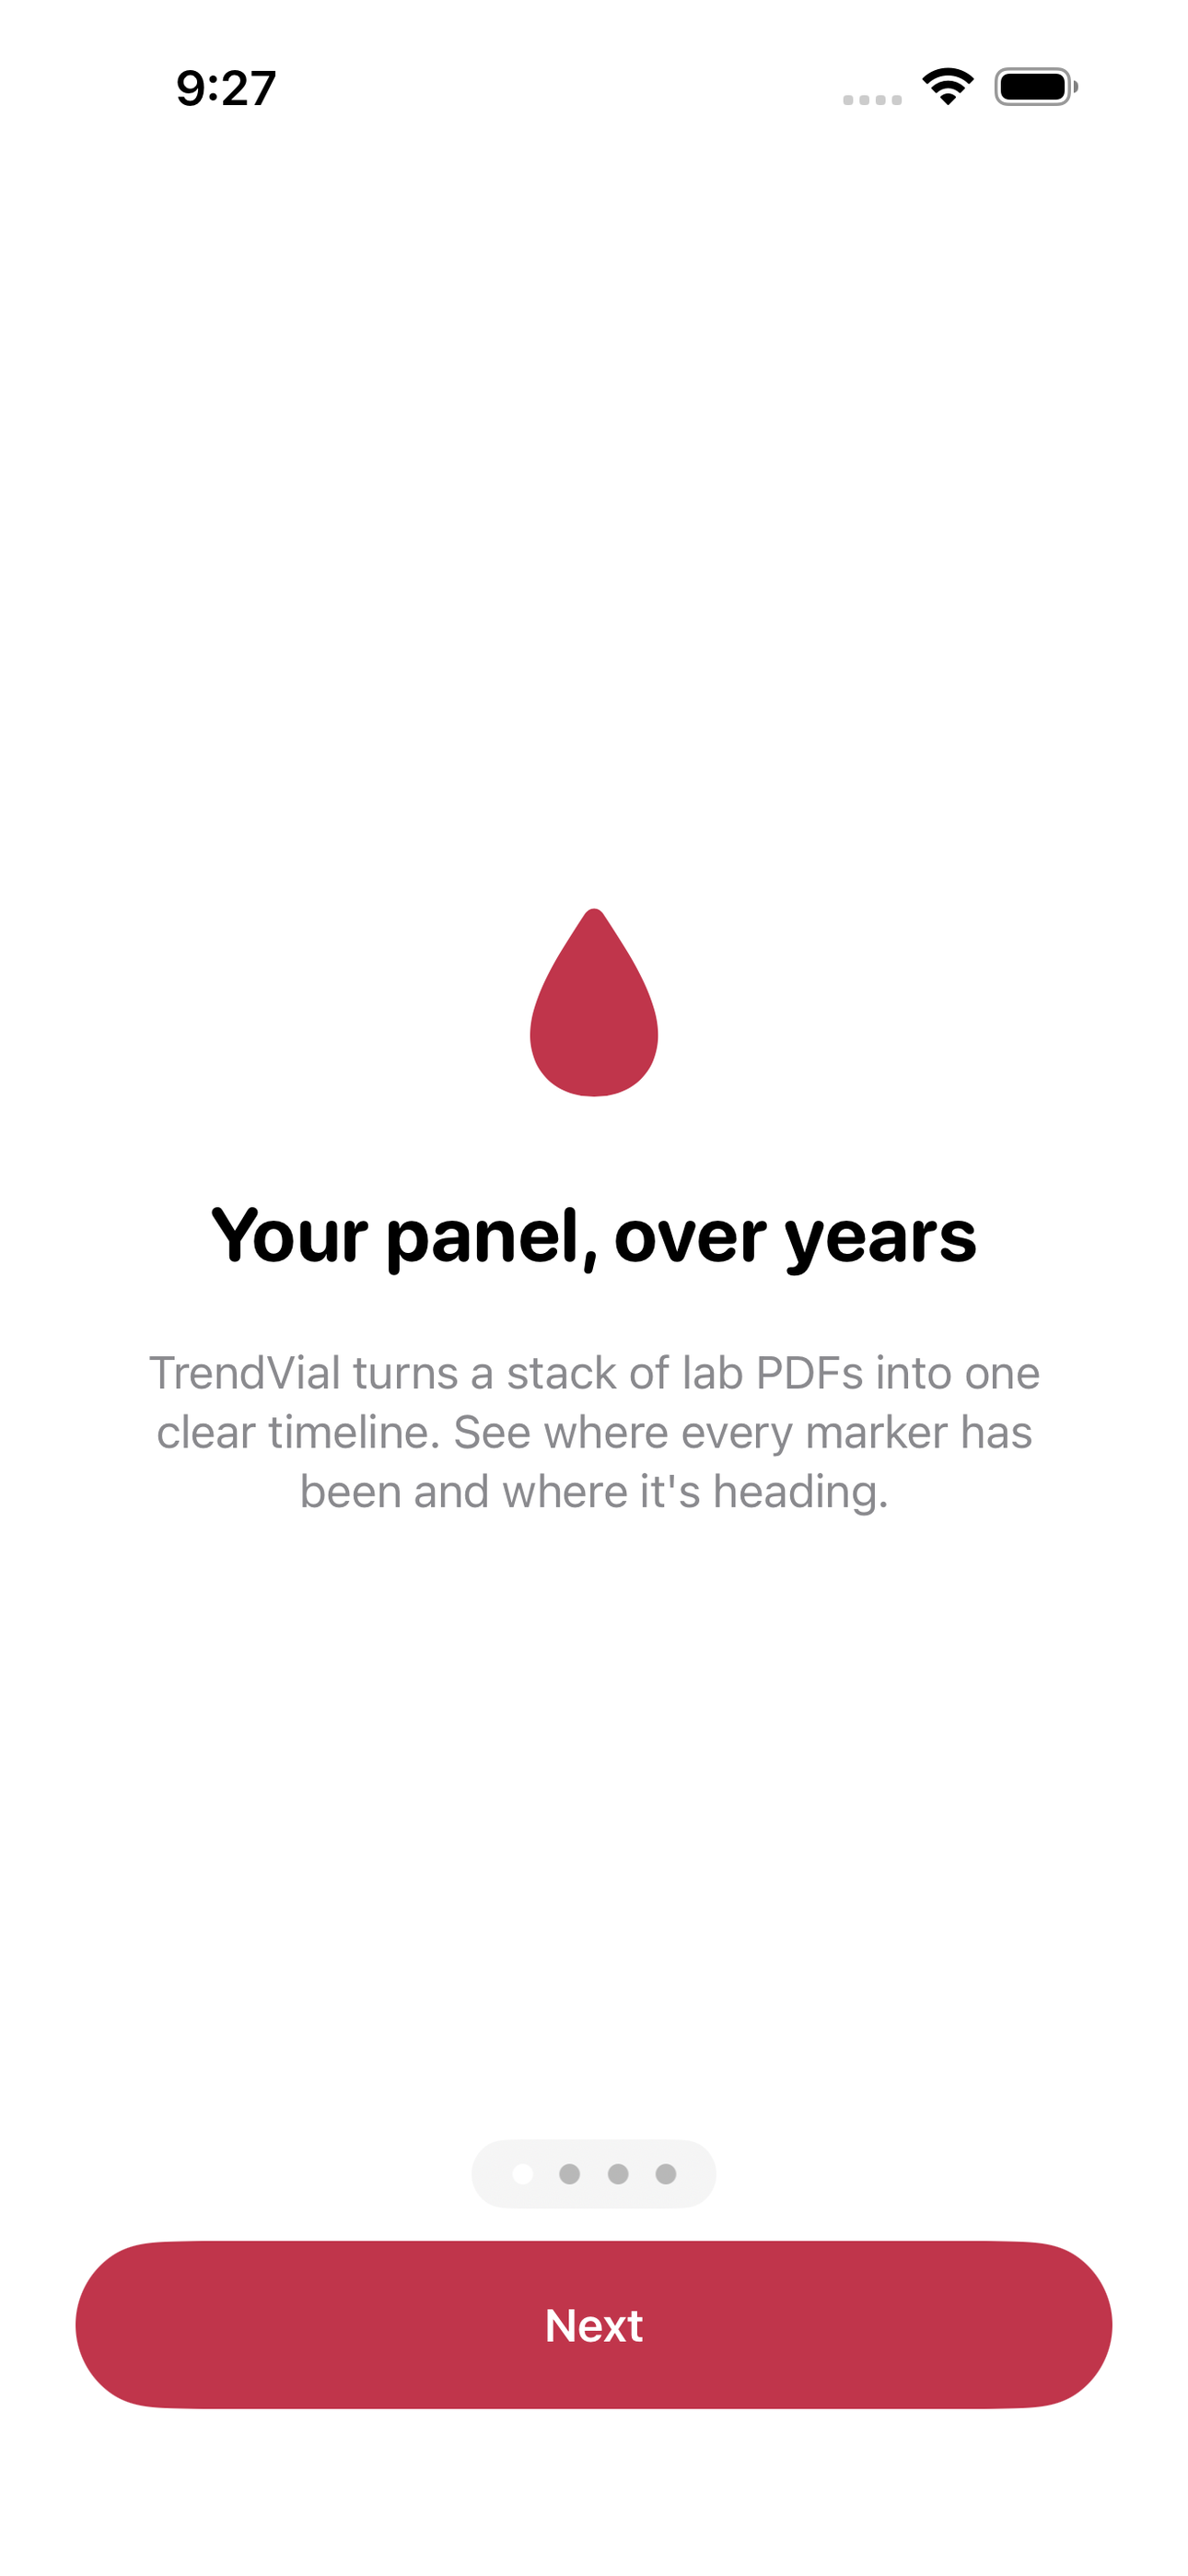
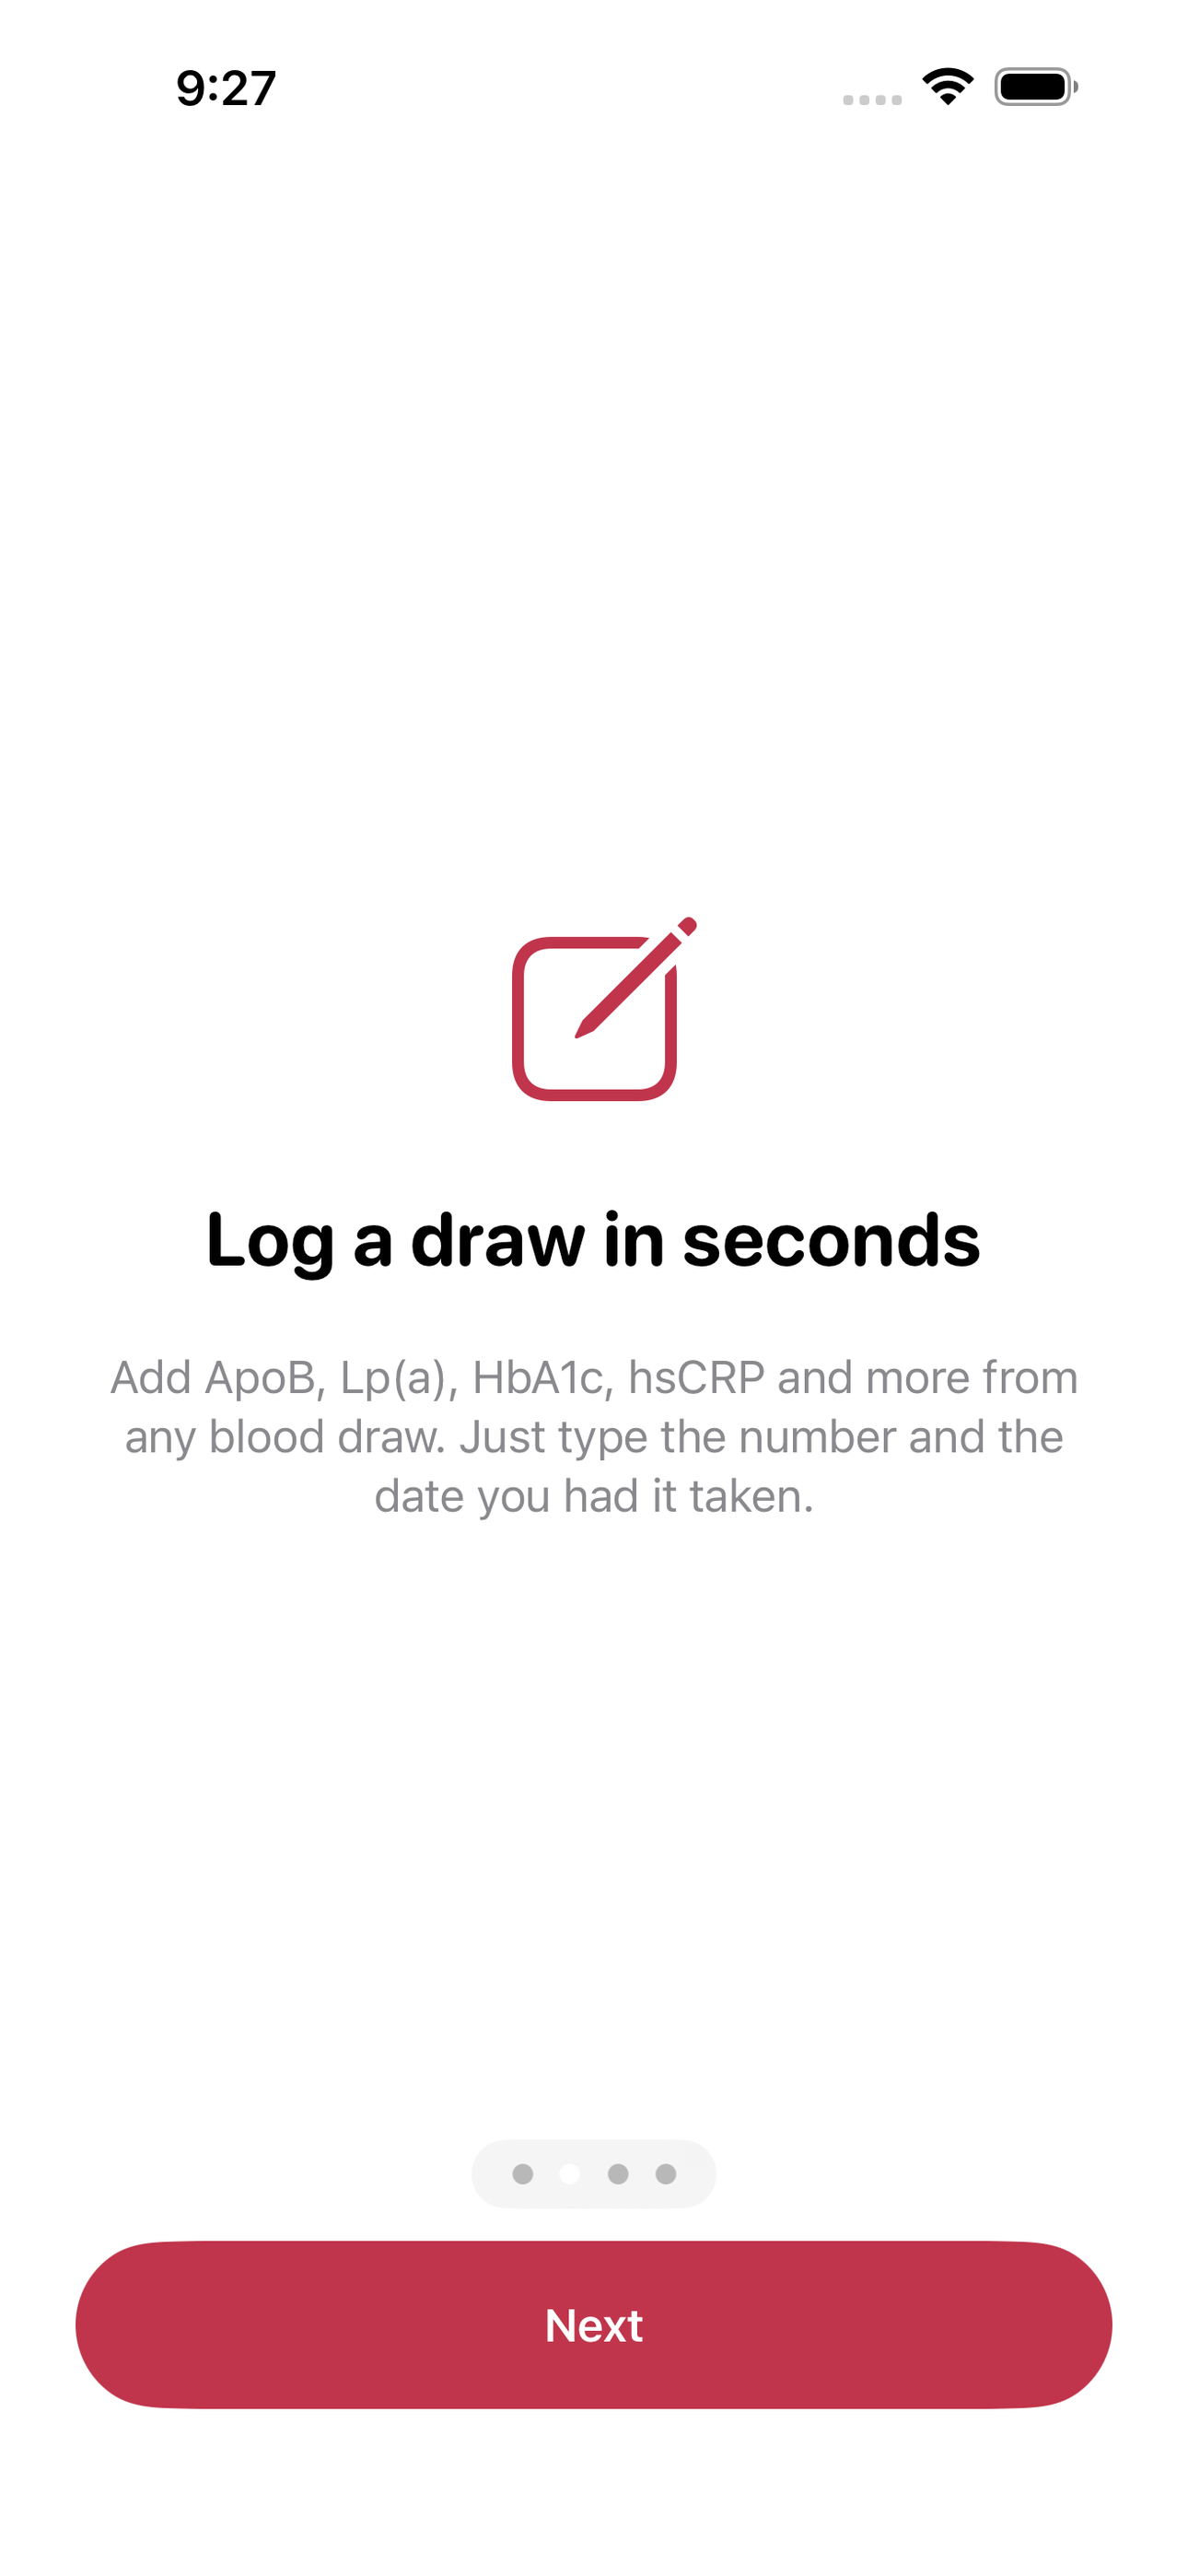
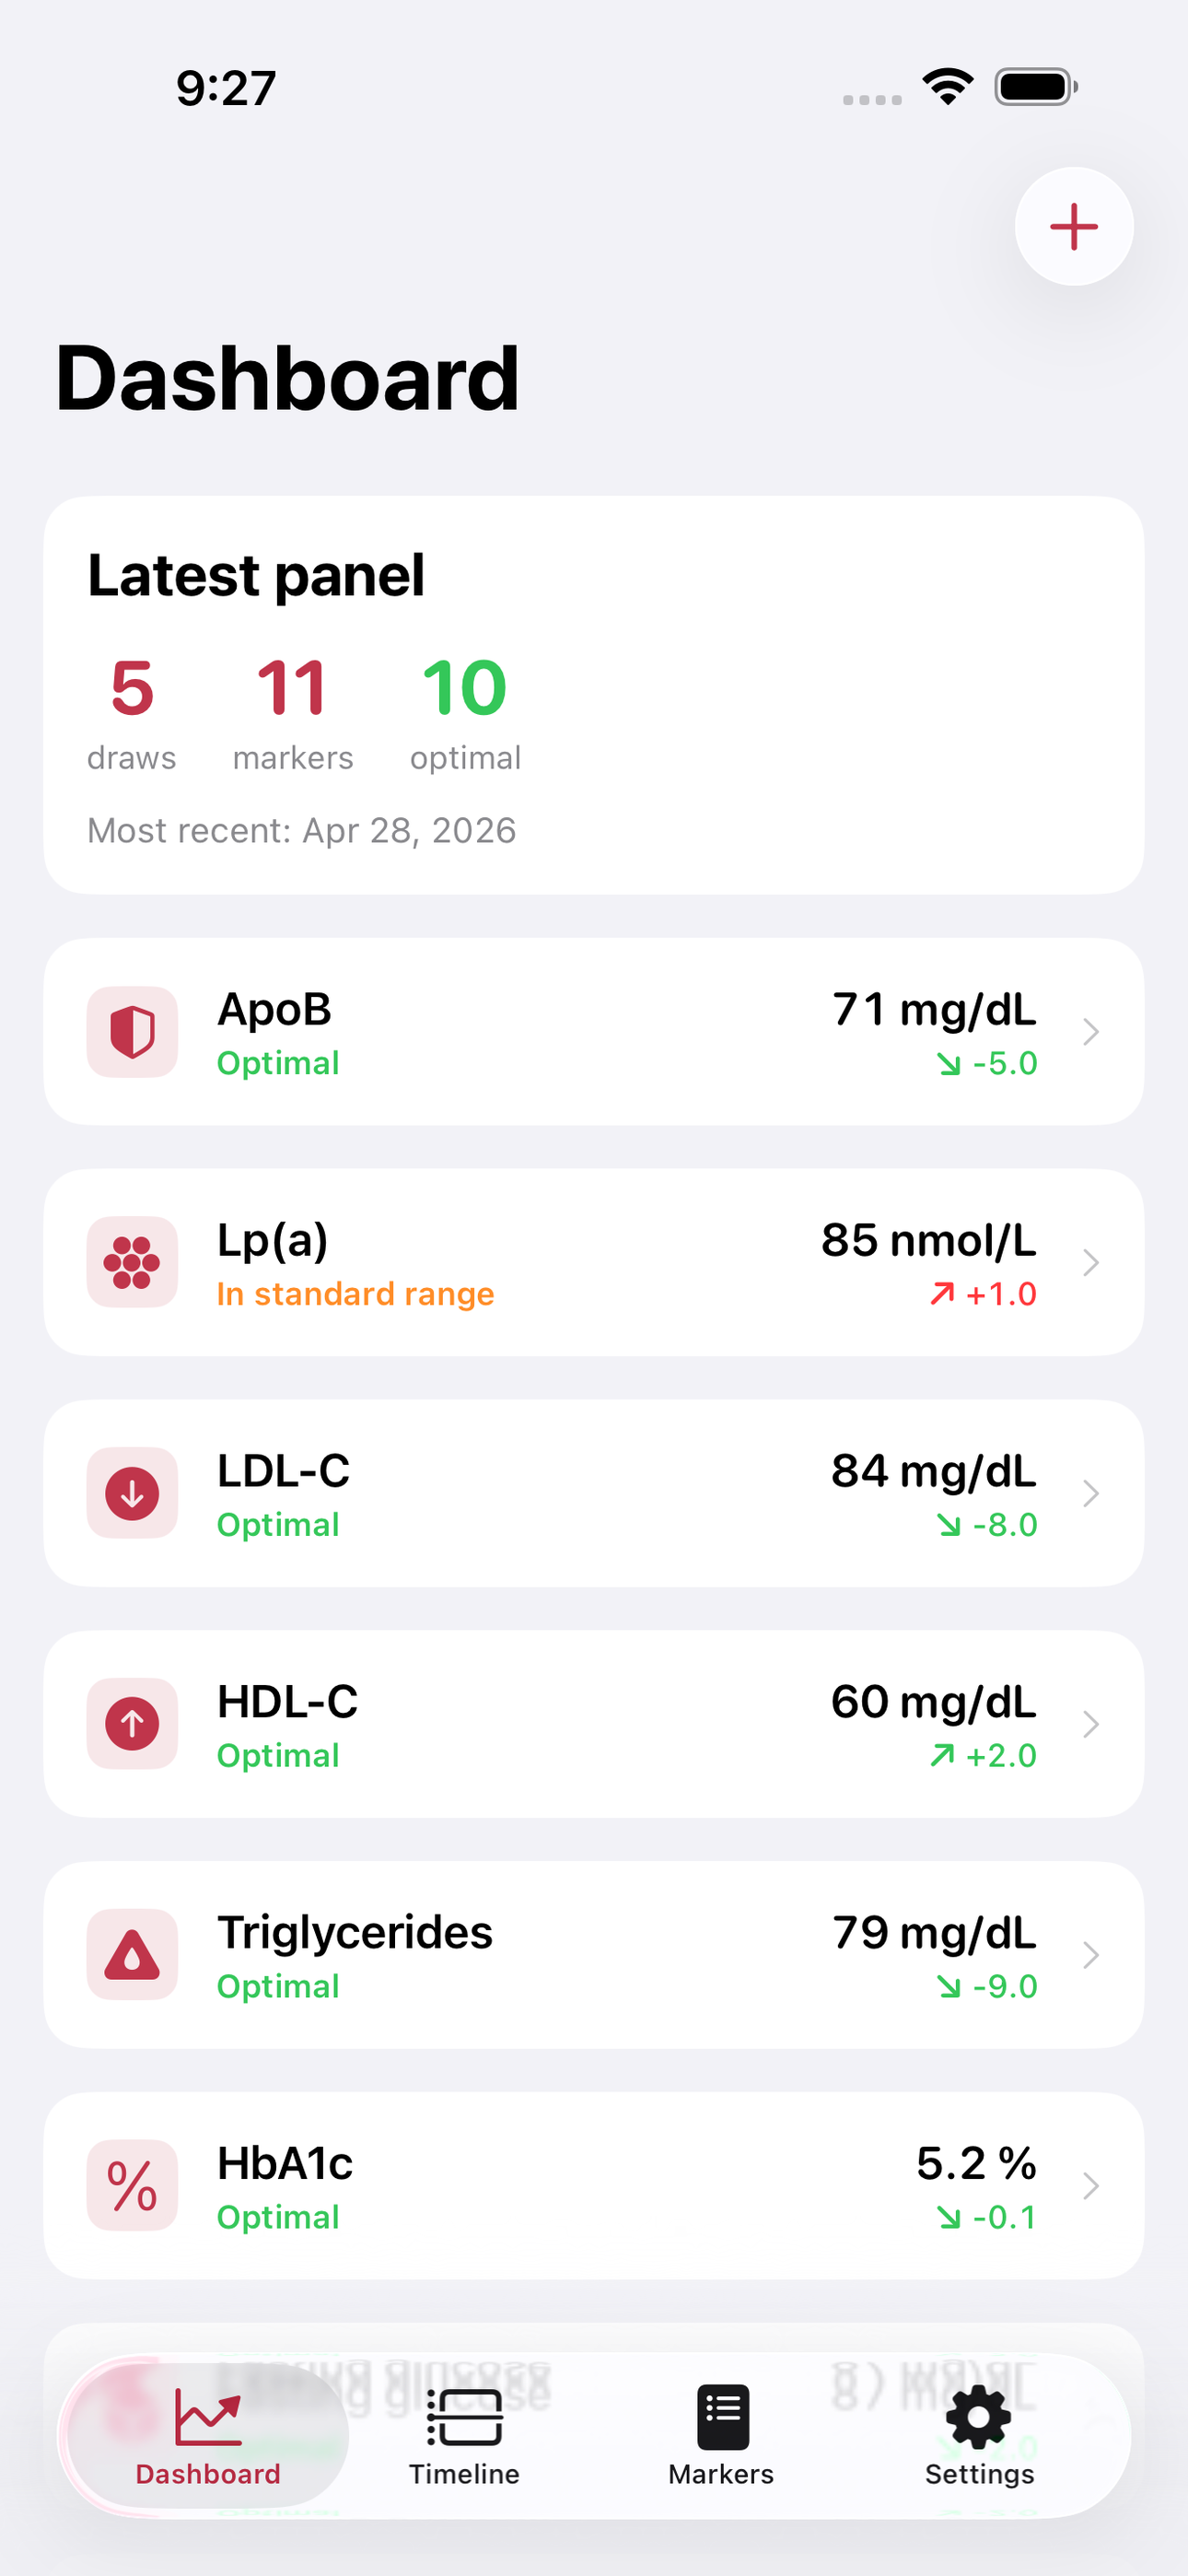
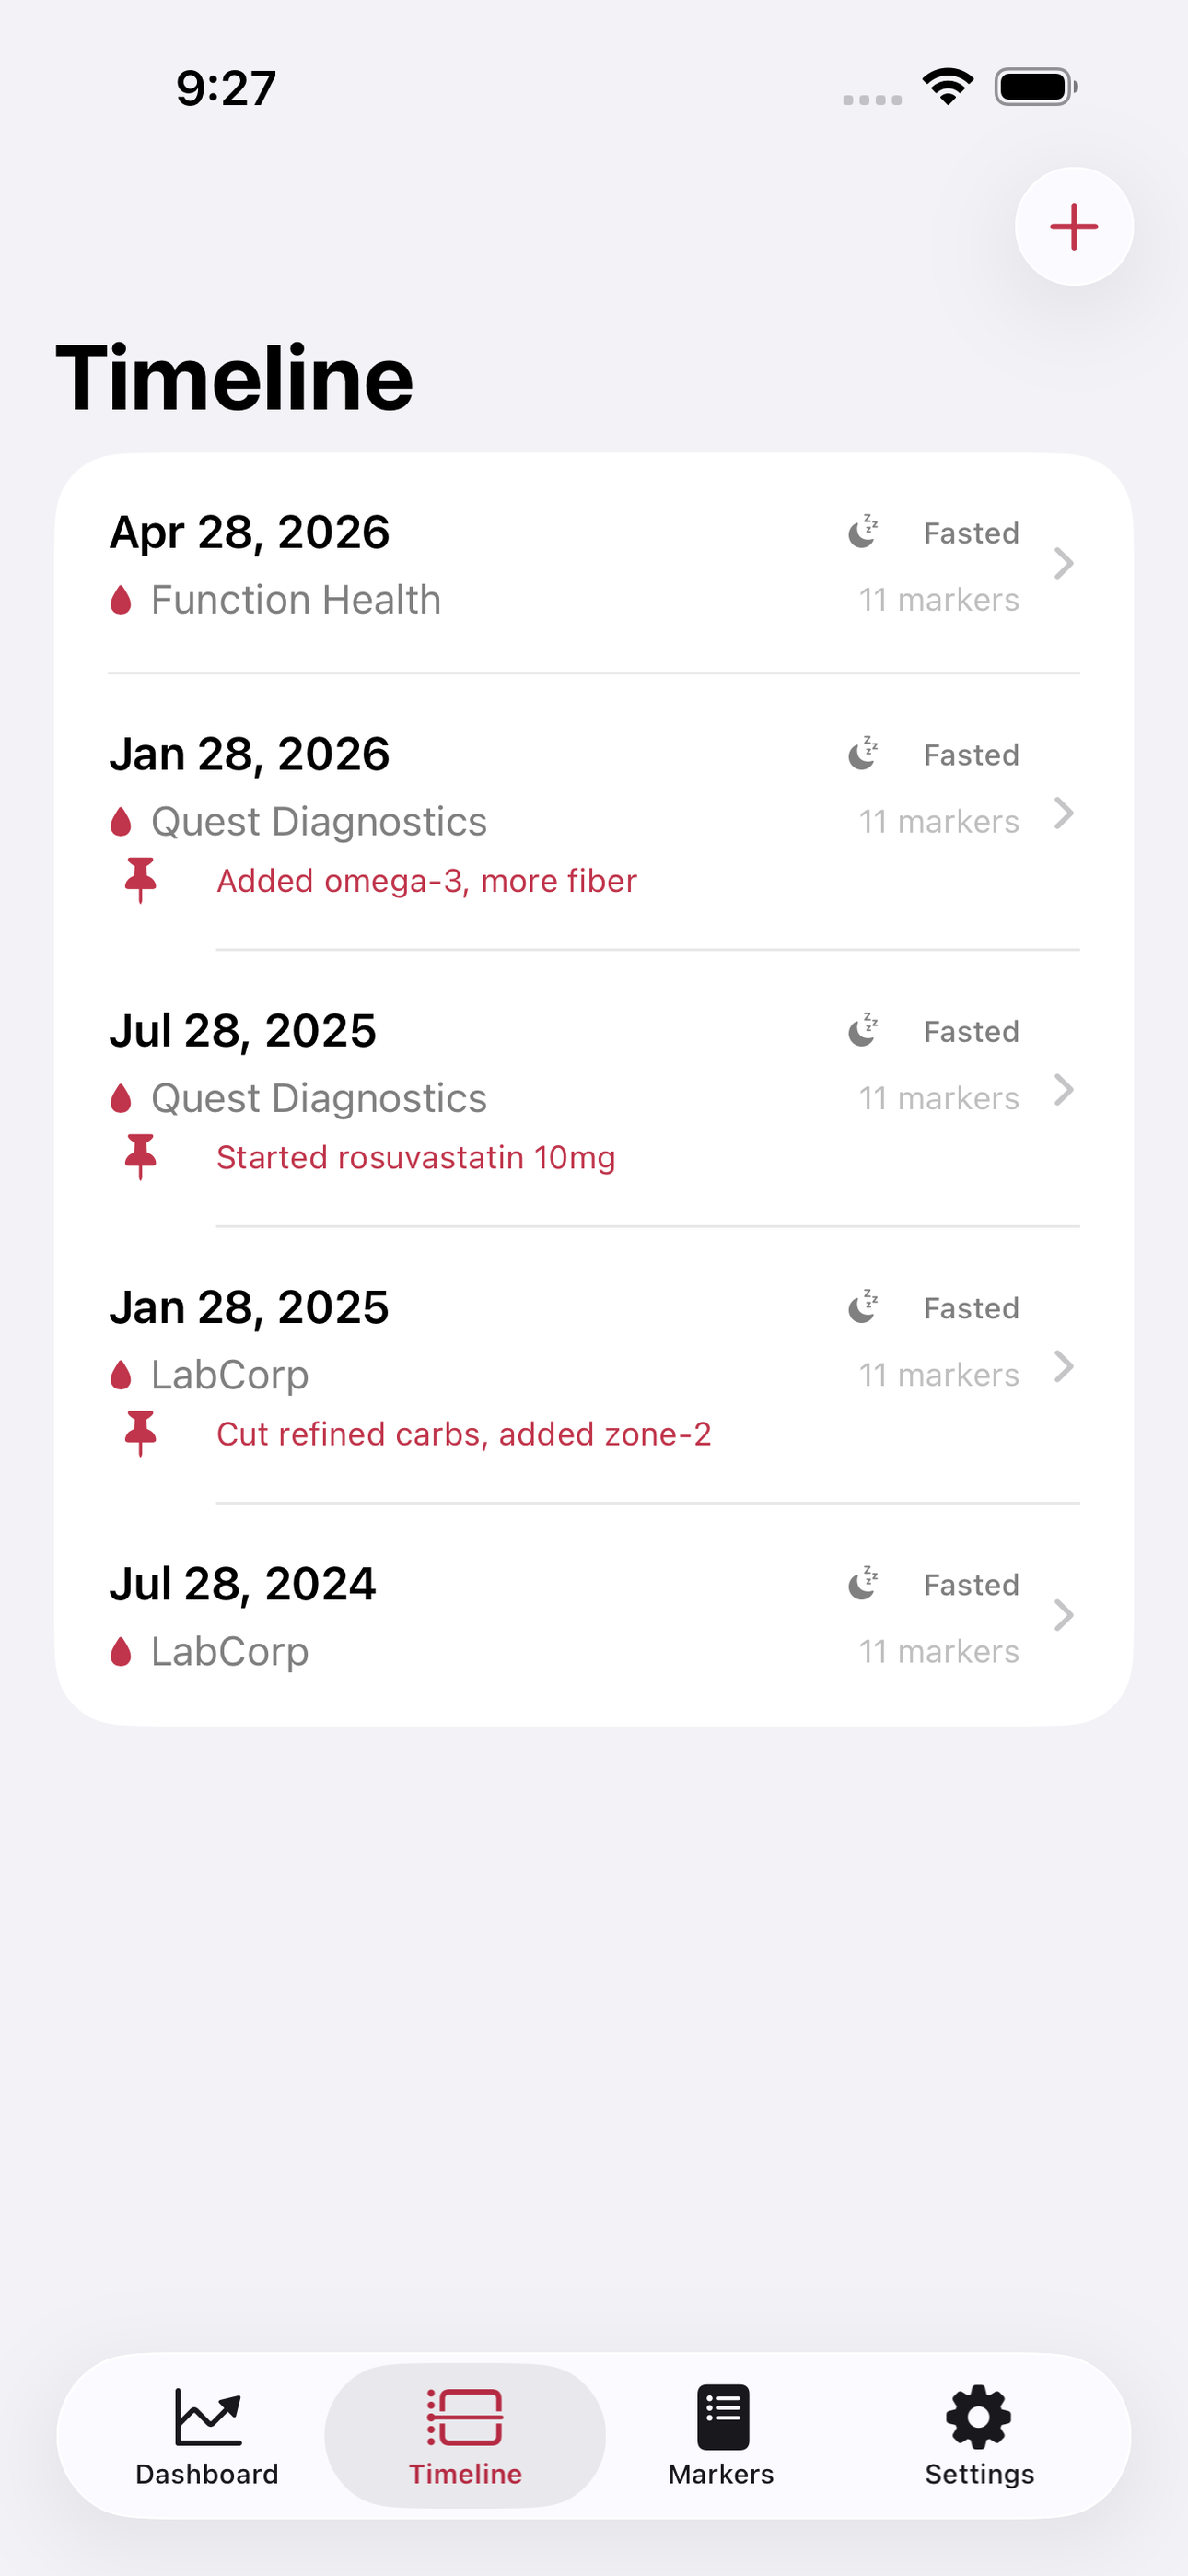
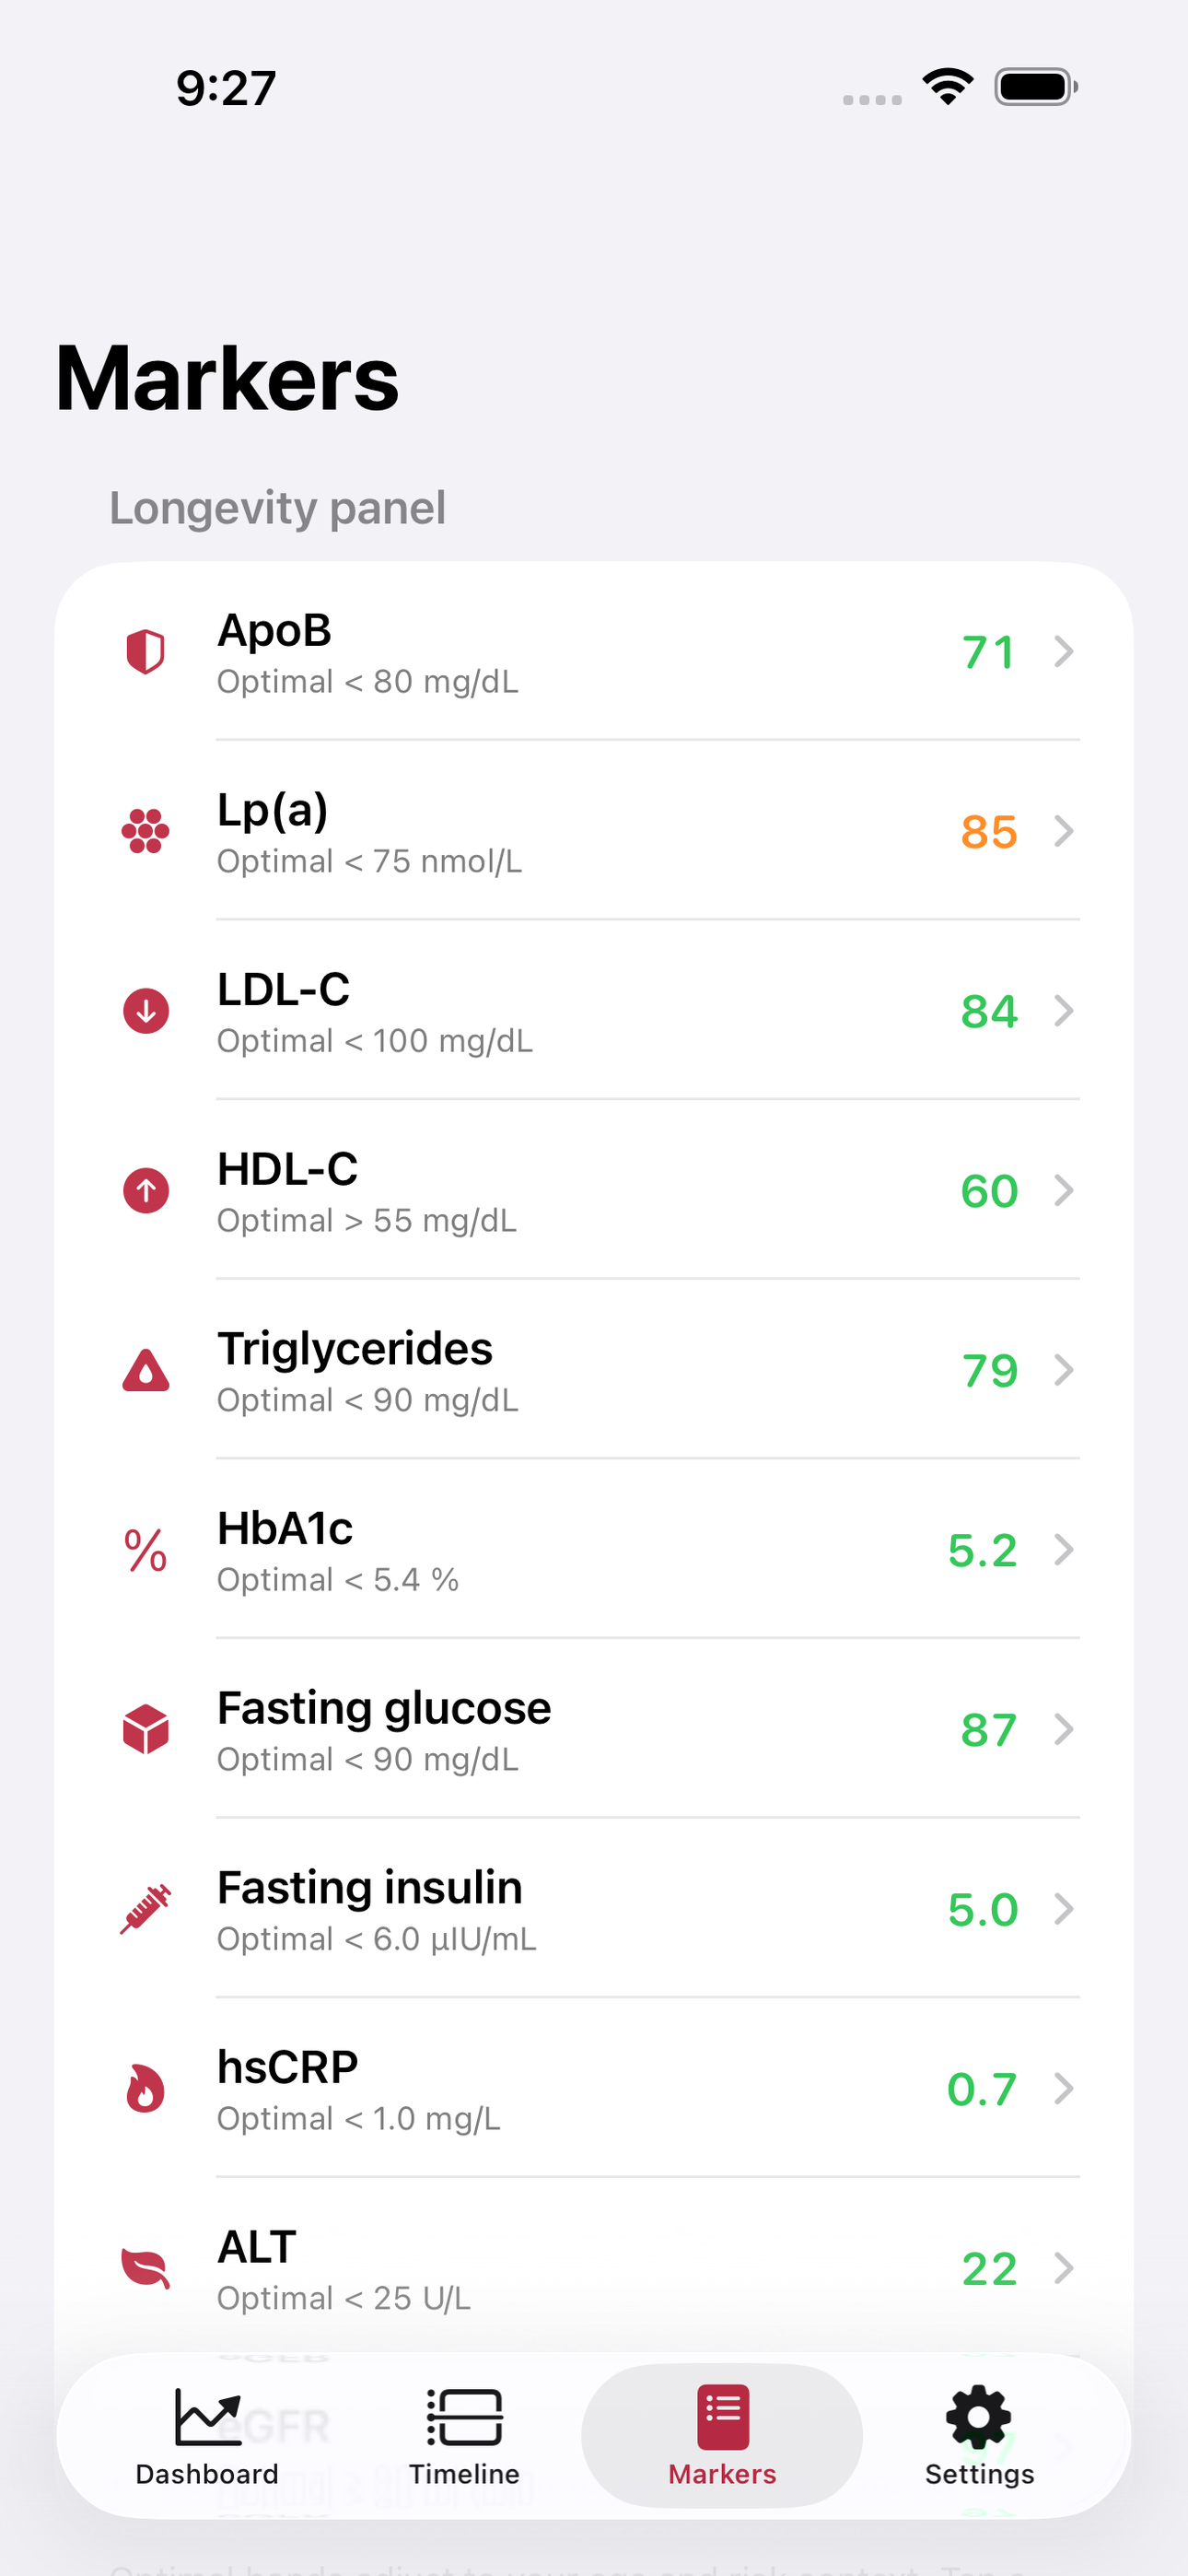
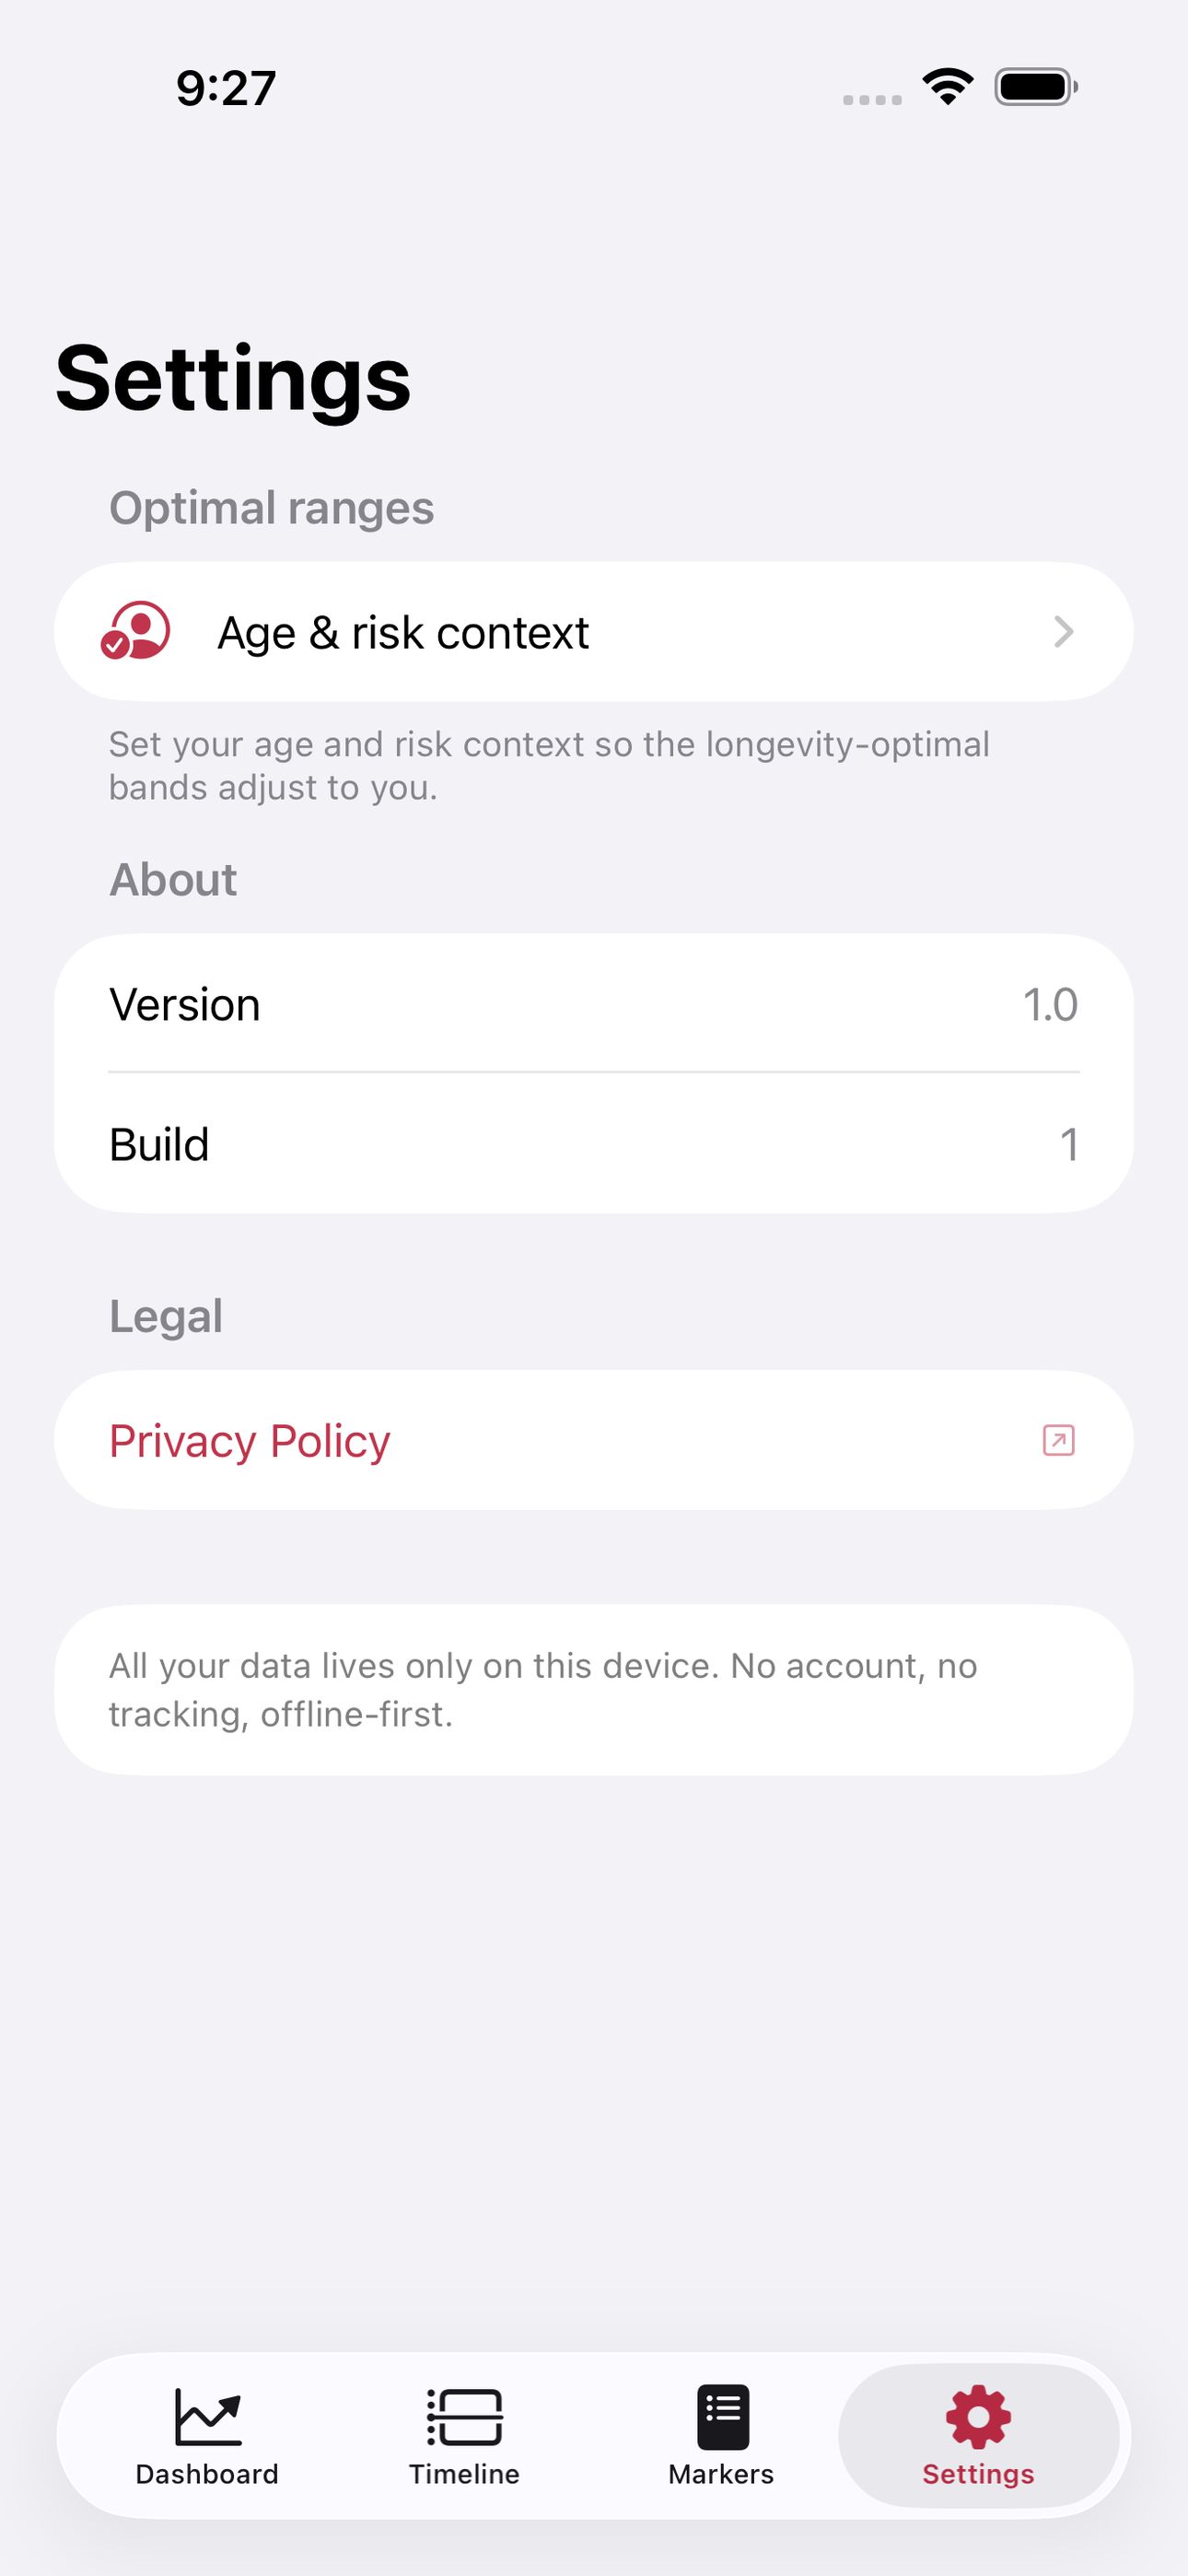
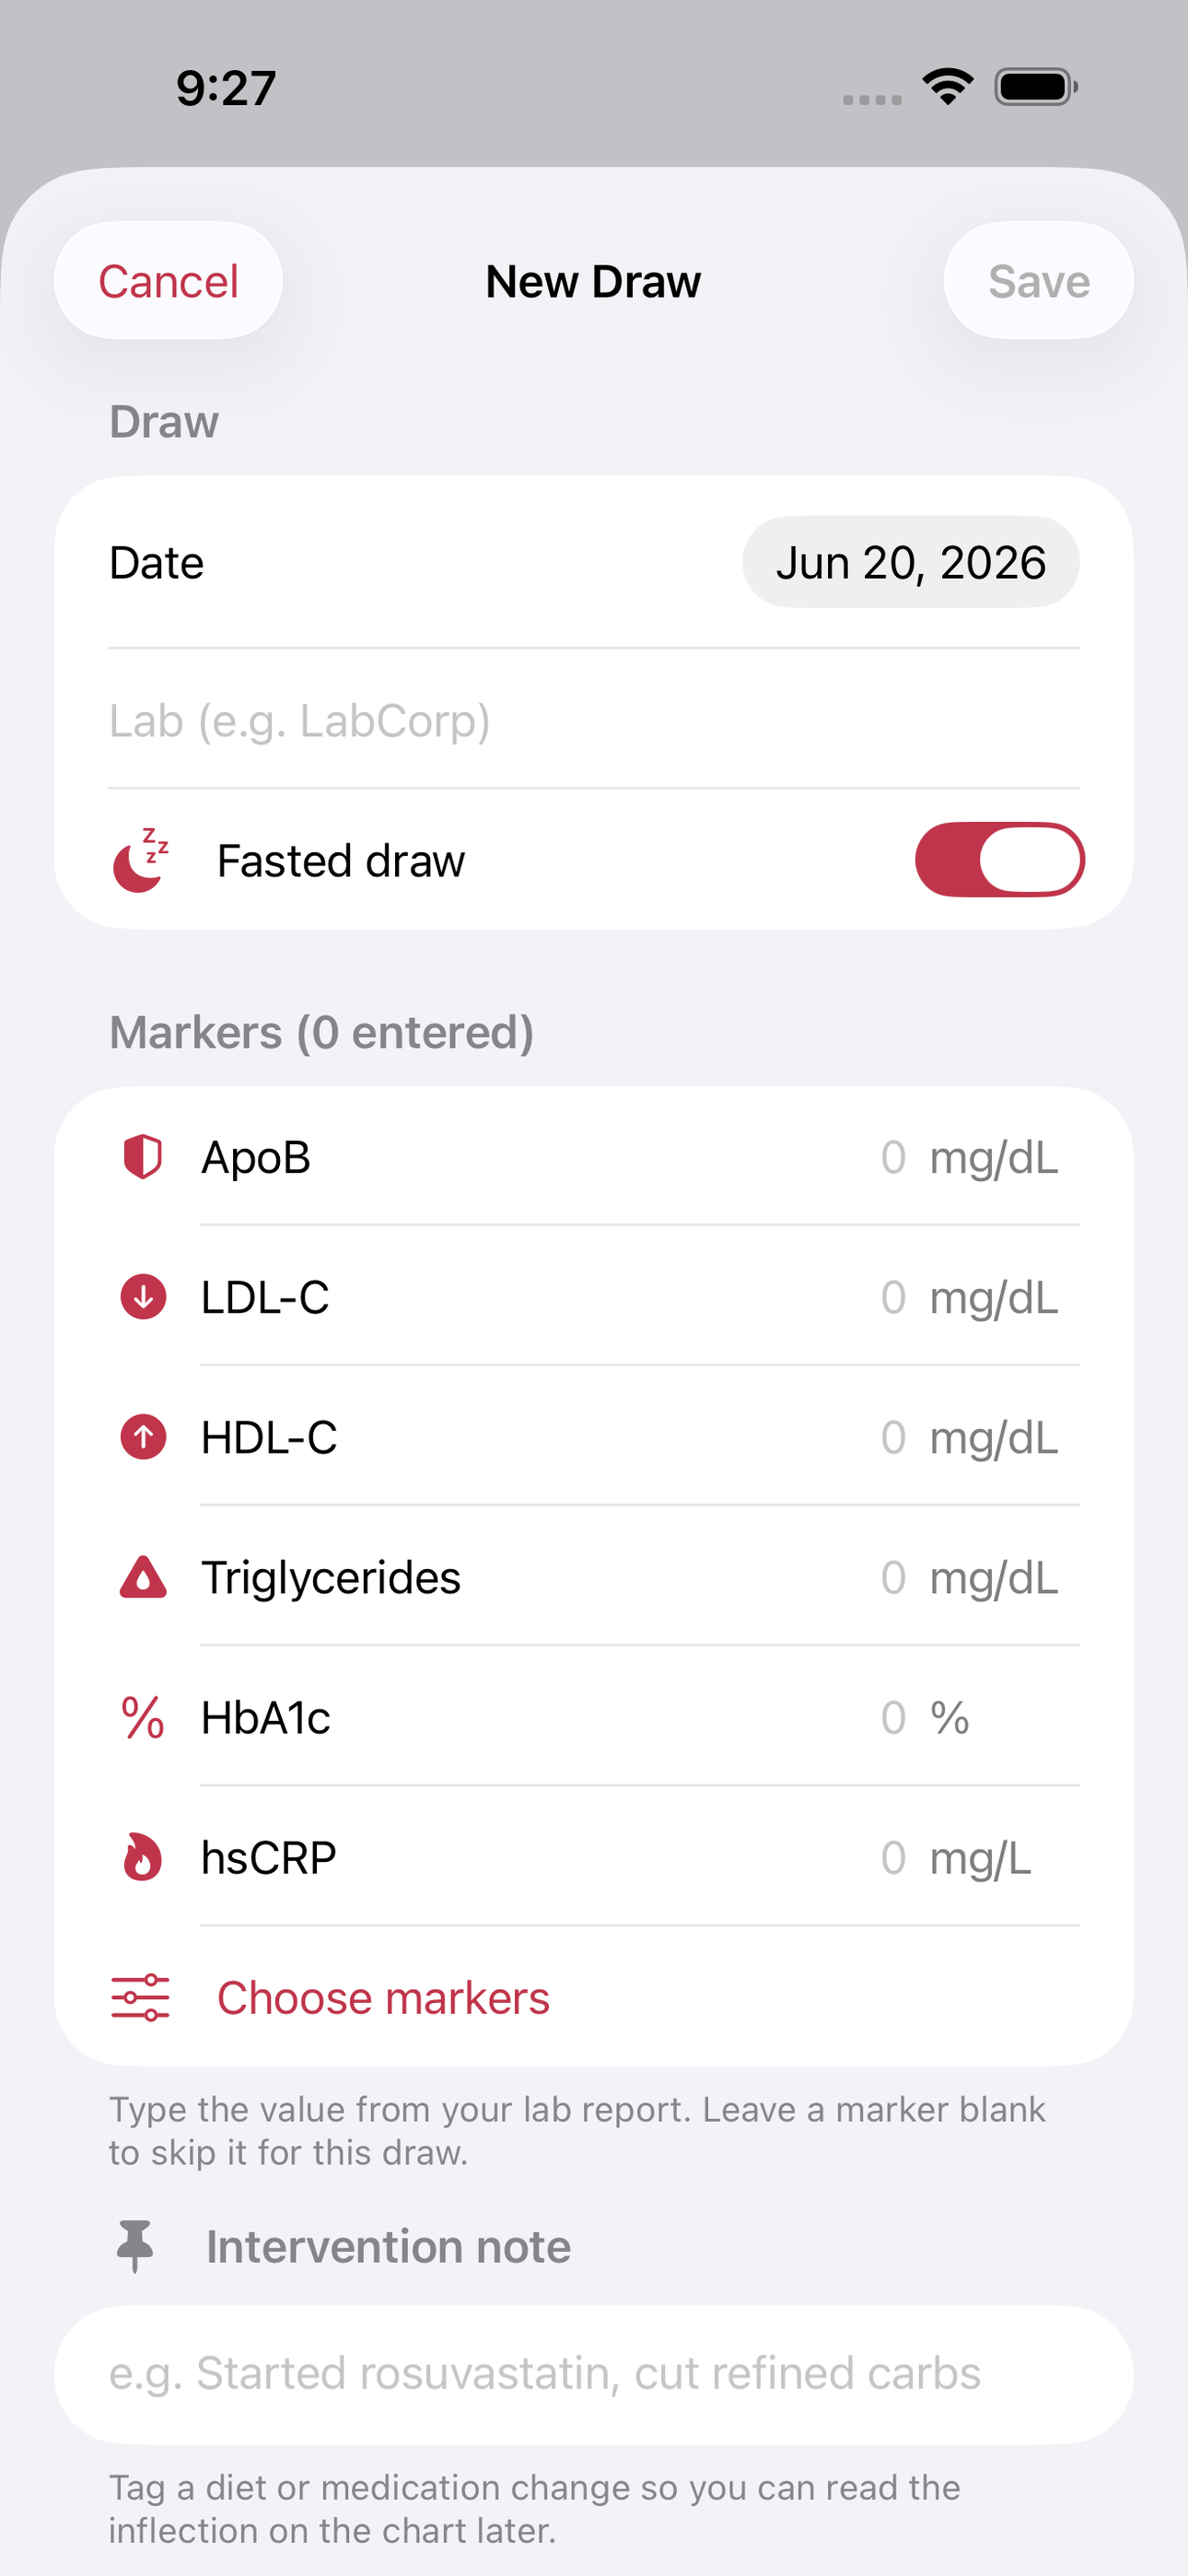
Tap any screenshot to open the full-resolution version.
What's inside
- Panel timeline — Every blood draw becomes a dated entry; tap any marker to see its full longitudinal chart across all draws with standard and optimal bands overlaid.
- Quick draw entry — Add a draw in under a minute: pick markers from the curated library, type values and the draw date, tag it as fasted, and optionally note an intervention.
- Optimal-vs-standard bands — Each marker renders both the population reference range and the stricter longevity-optimal band, adjusted to the user's age and risk context set during onboarding.
- Direction of travel — A panel dashboard shows every marker with an up/down arrow, the delta since the last draw, and plain-language literacy notes on which way is favorable.
Why we built it
Lab portals show one result at a time graded against a population-wide reference range that says 'normal' even when a value is far from longevity-optimal, and offer no clean multi-year view of a whole panel's direction of travel.
What makes it different
TrendVial is a longitudinal multi-marker panel timeline with dual standard-vs-optimal bands and direction-of-travel notes. Incumbents differ: lab portals (LabCorp, Quest) show isolated results with only standard ranges and no optimal context; Function Health and Superpower are subscription, cloud-bound services tied t…
Who it's for
Anyone who wants honest tracking without a coach, a subscription, or a streak guilting them at 11pm.
In one line: Longevity blood panel trends, offline
Try it
See the Longevity blood panel trends, offline for the full feature list, the info table, and support links.
Use TrendVial, found a bug, or have a feature request? Comments are open below — anonymous is fine.
0 comments
No comments yet — be the first.
Leave a reply
Sign in with Google to join the conversation. We require a quick sign-in to keep comments spam-free.
Sign in with Google to comment