
Web app · Health And Fitness
TrendVial
Your lab says normal. Plot it against the longevity-optimal band instead.
Enter the markers from each blood draw and TrendVial charts every value over time against two bands at once: the standard lab reference range and the stricter longevity-optimal band, adjusted for your age and risk. Free, offline, no portal login.
Stored in your browser only. Nothing you do in the web version is sent to our servers. Clear your browser data and it's gone — so export a backup from the in-app menu if you want to keep it.
This app is a community proposal.
Try the full browser version now. We build the iPhone and Android app once 100 people upvote it.
We'll email you once, when it ships. Unsubscribe anytime.
In your browser
What you can do in TrendVial on the web
Two bands on every chart
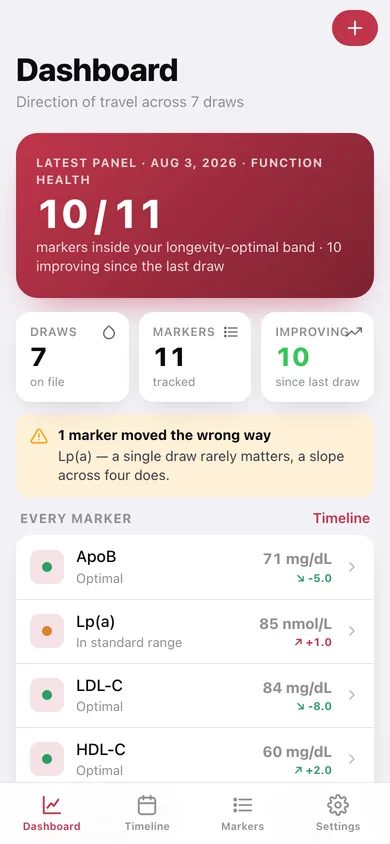
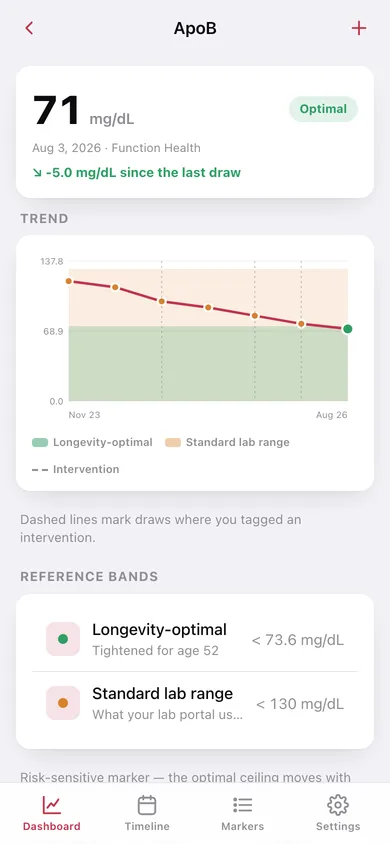
Each marker is plotted against the population-wide lab reference range in amber and the stricter longevity-optimal band in green, so you can see whether you are merely unusual or actually optimal.
The 11 markers longevity clinicians order
ApoB, Lp(a), LDL-C, HDL-C, triglycerides, HbA1c, fasting glucose, fasting insulin, hsCRP, ALT and eGFR — with the real bands and units, not placeholders.
Optimal bands that move with your context
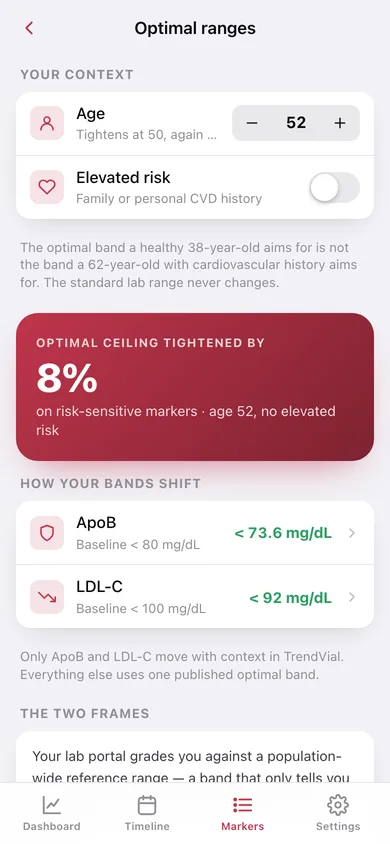
Set your age and whether you carry elevated cardiovascular risk and the ApoB and LDL-C ceilings tighten by up to 25%. The standard lab range never changes.
Direction of travel, not one reading
Every marker shows an arrow and the change since your last draw, coloured by whether that direction is favourable for that marker — falling ApoB is good, falling HDL is not.
Intervention tags on the timeline
Note the draw where you started a statin or cut refined carbs and the chart draws a line there, so you can read the inflection months later.
Yours, and exportable
No login, no portal scraping, no data broker. Export every reading as CSV or a JSON backup to take to your next appointment.
Screens
Every screen, rebuilt for the browser
-
1
Dashboard
How many markers sit inside your optimal band, what is improving, and every marker with its latest value and delta.
-
2
Marker trend
One marker's longitudinal chart with both bands, its reference ranges, total change and every reading.
-
3
Timeline
Every blood draw as a dated entry with the lab, fasted status and intervention note.
-
4
Draw detail
One draw's full set of readings with standing dots and the change against your previous draw.
-
5
New draw
Date, lab, fasted toggle, an intervention note and a value box for each marker you choose.
-
6
Marker library
All eleven curated markers with their optimal and standard bands and your latest value.
-
7
Optimal ranges
Your age and risk context, how much it tightens the ceiling, and the shifted band for every risk-sensitive marker.
-
8
Settings
Context, default panel, CSV export, JSON backup, sample data and erase.
Try it with sample data: Loads seven fasted draws spanning the last three years across LabCorp, Quest and Function Health — all eleven markers each time, with ApoB falling from 118 to 71 around a tagged statin start and a diet change. You can start fresh at any time.
Ready? It's free.
No account, no install, no subscription. Everything you do stays in this browser.
Your say
What should TrendVial do? Tell us before we build it.
Tell us what to build next.
Comments need a free Google sign-in, so every one is from a real person.
Sign in with Google to commentNo comments yet — be the first to say what this app should do next.
Questions
Is the web version of TrendVial free?+
Yes. Every screen is free to use: no subscription, no in-app purchases, no account.
Do I need an account?+
No. Open TrendVial and start using it right away. Sign in with Google only if you want to upvote an app, save it to your list, or leave a comment.
Where is my data stored?+
Only in this browser's local storage. Nothing you enter is sent to our servers, so we can't see it, back it up, or restore it. Clearing site data, a private window, or another device starts empty. Export a backup from the in-app menu to keep it.
Is there a TrendVial app for iPhone or Android?+
Not yet. TrendVial is a community proposal: the browser version is complete, and we build the iPhone and Android app once 100 people upvote it. Upvoters get one email when it ships.