
Web app · Business
PlowLog
The snow-plow service log your insurance agent keeps telling you to keep — in any browser
START PUSH stamps arrival, END PUSH stamps departure. Log snowfall depth, air temp, surface state and material spread with glove-friendly controls, group pushes under named storms, total billing by client and month, and print a chronological service report for the adjuster. Free, no account.
Stored in your browser only. Nothing you do in the web version is sent to our servers. Clear your browser data and it's gone — so export a backup from the in-app menu if you want to keep it.
This app is a community proposal.
Try the full browser version now. We build the iPhone and Android app once 100 people upvote it.
We'll email you once, when it ships. Unsubscribe anytime.
In your browser
What you can do in PlowLog on the web
One-tap push logger
Pick the property and the clock starts with your arrival stamped; end it on pull-out and the departure, duration and geotag (if your browser allows location) are on the record for good.
Conditions and material per visit
Snowfall depth in half-inch steps, air temperature, surface state (snowpack, ice, slush, wet, clear) and salt / sand / brine / mix with a quantity — captured in under thirty seconds.
Property service history
Every driveway and lot gets a permanent record: client, per-push / seasonal / hourly rate, site notes, evidence photos and a reverse-chronological ledger of every push.
Storm events
Name each storm with total snowfall and group pushes under it; a running or just-ended storm is suggested automatically when you start a push.
Per-push billing
Month-end totals per client computed from the log — per-push rates, hourly rates from the timestamps, seasonal contracts flagged — with mark-invoiced per push or per client, and a season rollup CSV.
Defense service report
One property's complete history — timestamps, conditions, materials, storm, geotag and photos — as a dated report you print or save as PDF for a claim letter or insurance adjuster.
Screens
Every screen, rebuilt for the browser
-
1
Dashboard
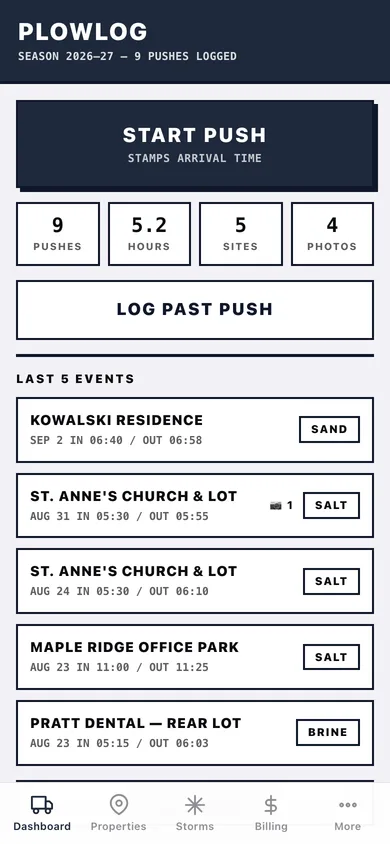
START PUSH slab (or resume the running one), season pushes / hours / sites / photos, log a past push, and the last five events.
-
2
Push in progress
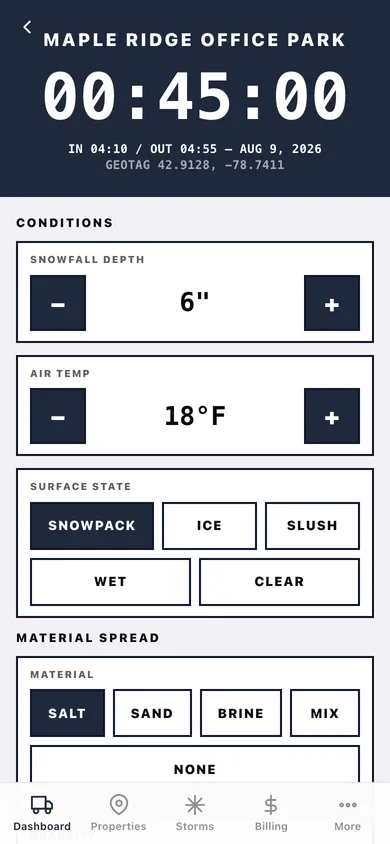
Giant elapsed timer with arrival stamp, oversized conditions and material controls, photo capture and END PUSH.
-
3
Push record
In / out / duration punch card, conditions grid, material, storm, geotag, photos, notes and invoiced state.
-
4
Log past push
Full manual form: property, arrival, departure, conditions, material, storm and notes.
-
5
All events
Every service record grouped by month.
-
6
Properties
Every site with client, rate line, push count and last service.
-
7
Property history
Site header, GENERATE SERVICE REPORT, site notes, evidence photos and the full service history.
-
8
New / edit property
Name, address, client, phone, rate type and rate, notes.
-
9
Storms
Season snowfall total and every named storm with its push count.
-
10
Storm detail
Started / ended / snowfall and the pushes logged under this storm.
-
11
New / edit storm
Label, start, end (or still open), total snowfall and notes.
-
12
Billing
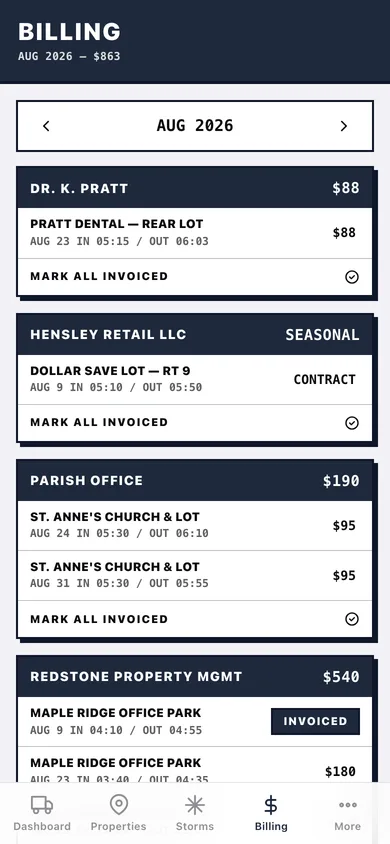
Month picker, per-client cards with every push and amount, mark invoiced per push or all at once.
-
13
Season rollup
Season totals by client and by property with a CSV download.
-
14
Photo vault
Every evidence photo with its property, time and geotag.
-
15
Service report
Printable chronological service history for one property with photos and notes toggles.
-
16
More
Business and operator name for reports, records shortcuts, backup, sample data and erase.
Try it with sample data: Loads Northline Snow & Ice's last month: five properties (per-push, seasonal and hourly), three storms — a lake-effect band, a nor'easter and an ice event — nine pushes with conditions and materials, two already invoiced, and four time-and-location-stamped evidence photos. You can start fresh at any time.
Ready? It's free.
No account, no install, no subscription. Everything you do stays in this browser.
Your say
What should PlowLog do? Tell us before we build it.
Tell us what to build next.
Comments need a free Google sign-in, so every one is from a real person.
Sign in with Google to commentNo comments yet — be the first to say what this app should do next.
Questions
Is the web version of PlowLog free?+
Yes. Every screen is free to use: no subscription, no in-app purchases, no account.
Do I need an account?+
No. Open PlowLog and start using it right away. Sign in with Google only if you want to upvote an app, save it to your list, or leave a comment.
Where is my data stored?+
Only in this browser's local storage. Nothing you enter is sent to our servers, so we can't see it, back it up, or restore it. Clearing site data, a private window, or another device starts empty. Export a backup from the in-app menu to keep it.
Is there a PlowLog app for iPhone or Android?+
Not yet. PlowLog is a community proposal: the browser version is complete, and we build the iPhone and Android app once 100 people upvote it. Upvoters get one email when it ships.