Meet Kilowatch — Rate hike or usage? Know
Your electric bill jumped $60 and the bill itself won't tell you why.

Finance
Kilowatch
Rate hike or usage? Know.
Every feature, from the first launch.
No account, no login, no cloud. Everything runs on your device and works fully offline — nothing in this post is hidden behind a wall.
What Kilowatch does
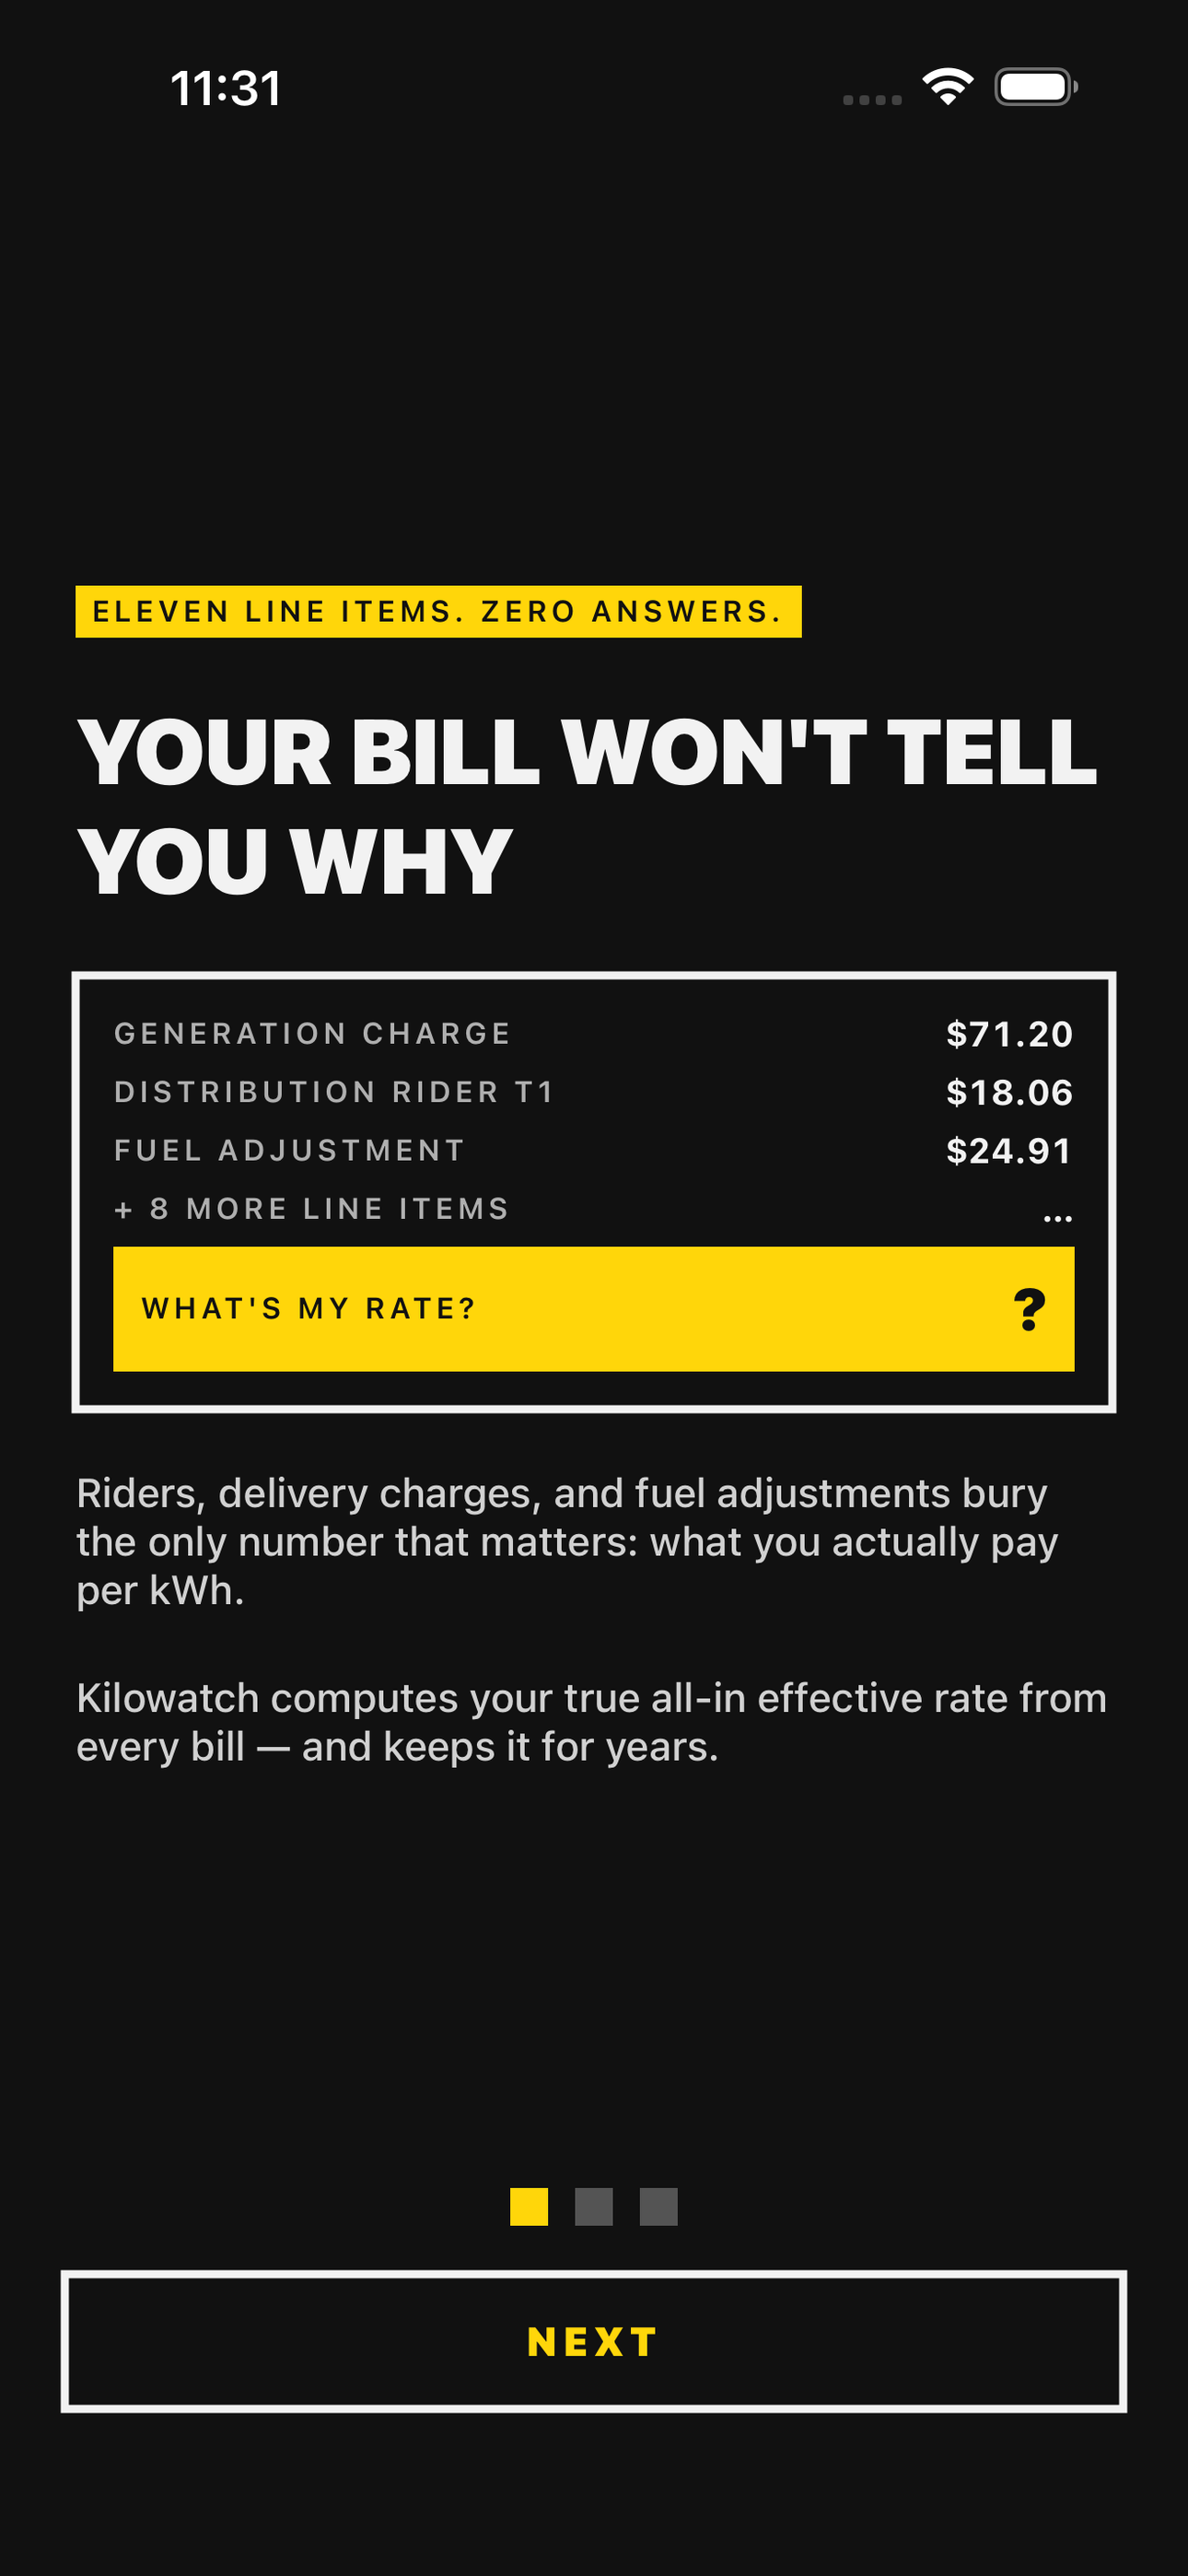
Your electric bill jumped $60 and the bill itself won't tell you why. Eleven line items of riders, delivery charges, and fuel adjustments bury the only number that matters: what you actually pay per kilowatt-hour. Kilowatch answers the question every household is asking right now — did I use more power, or did the rate go up on me?
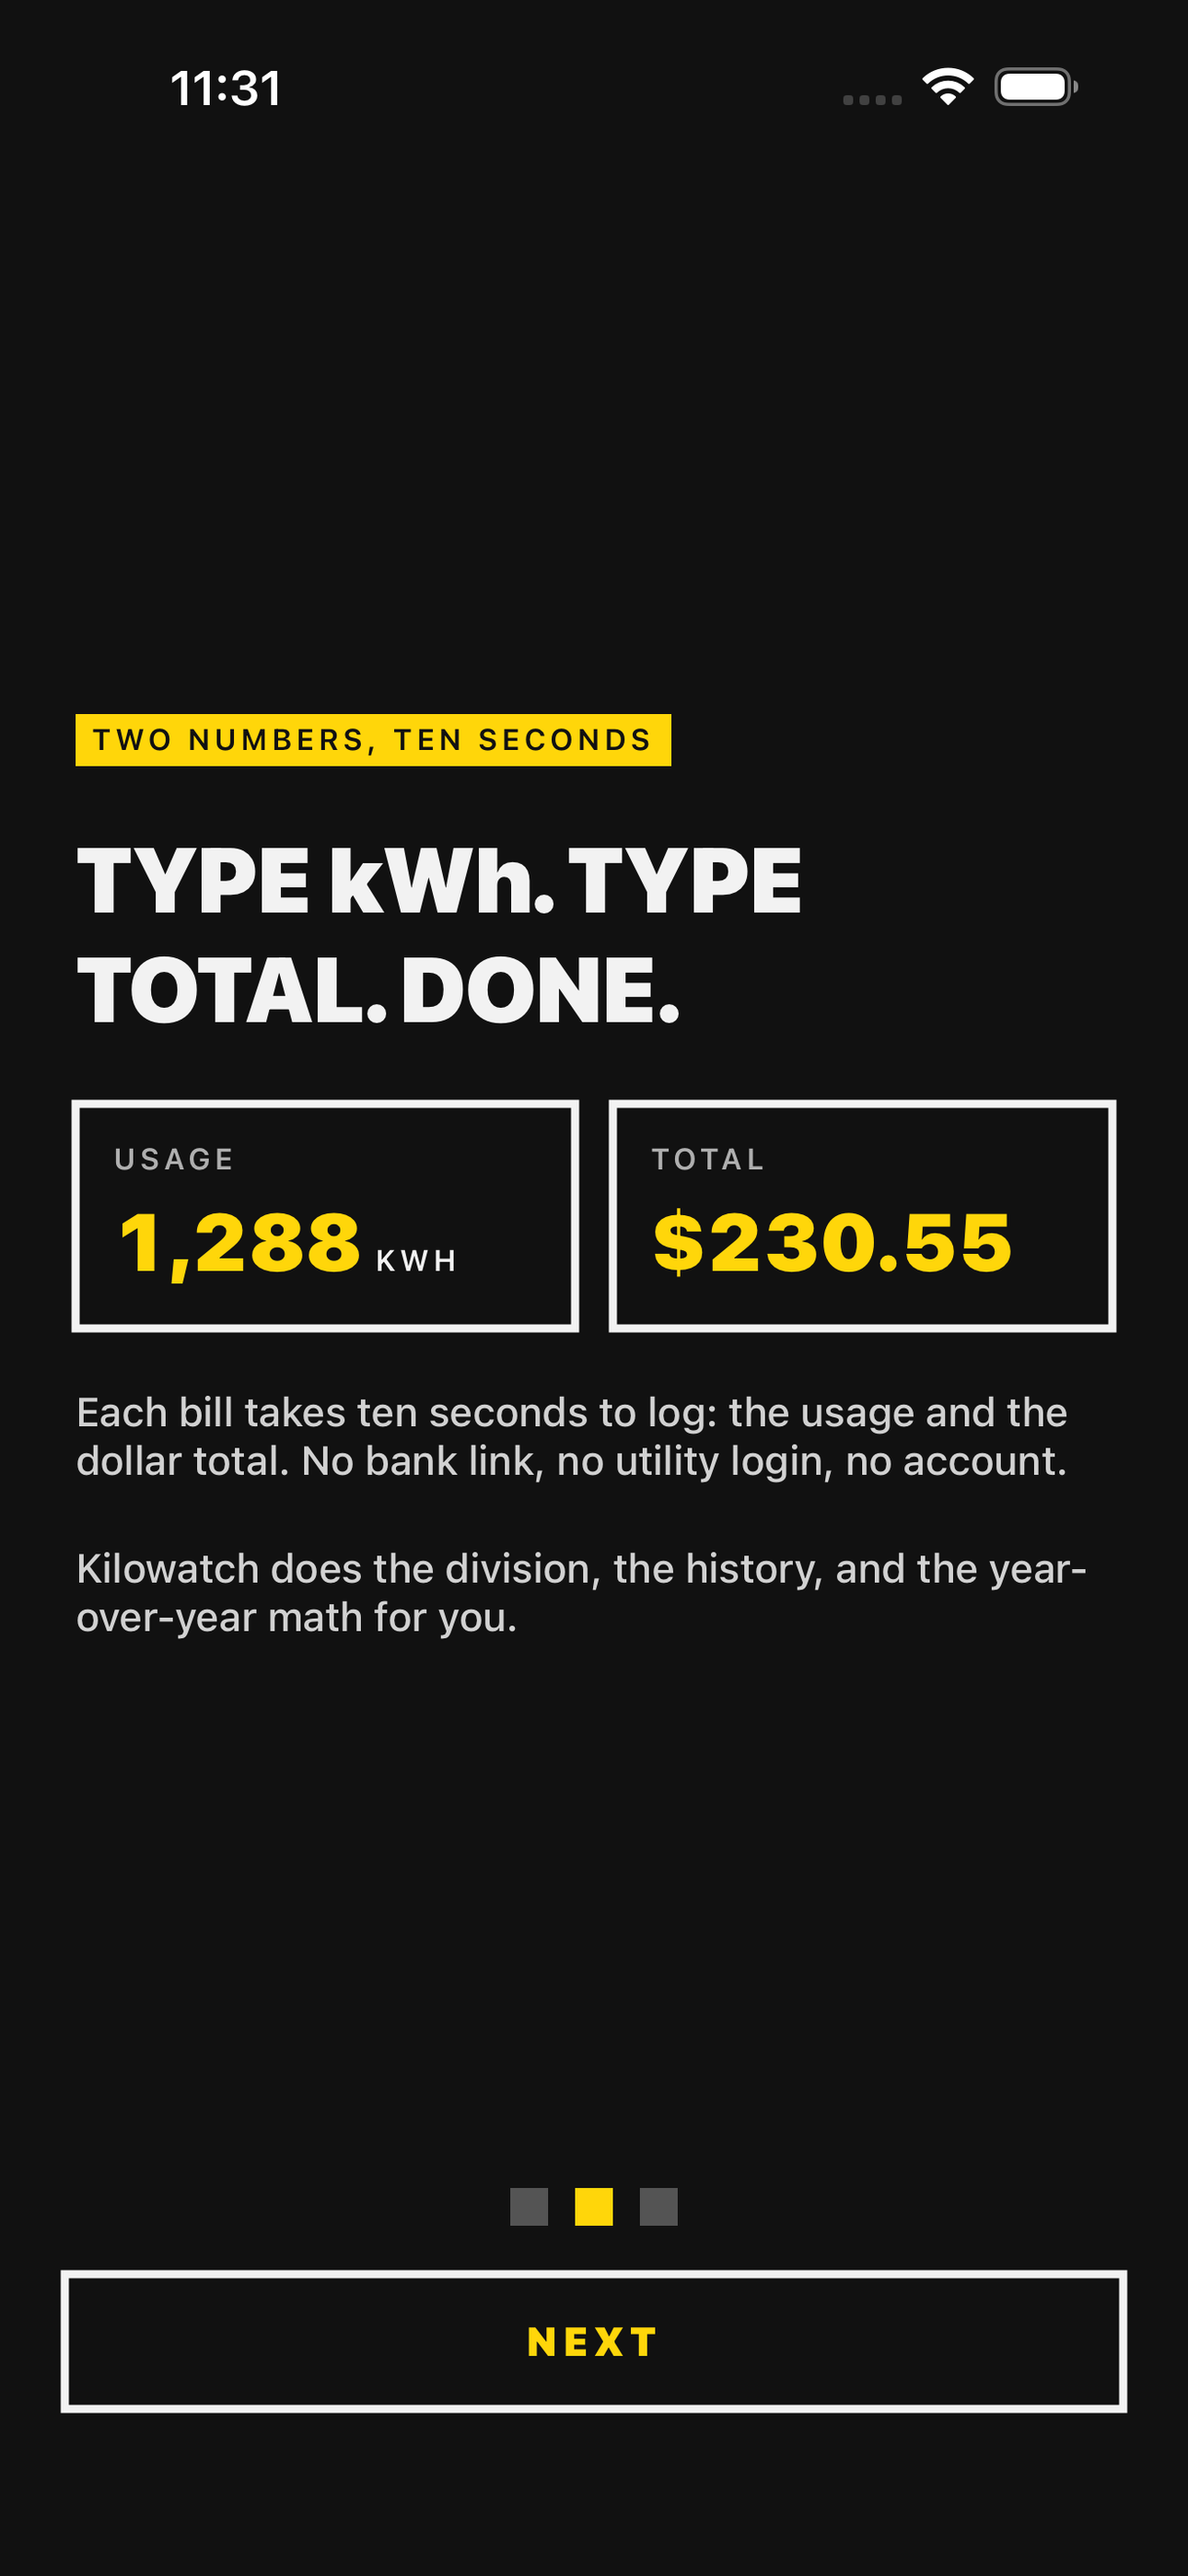
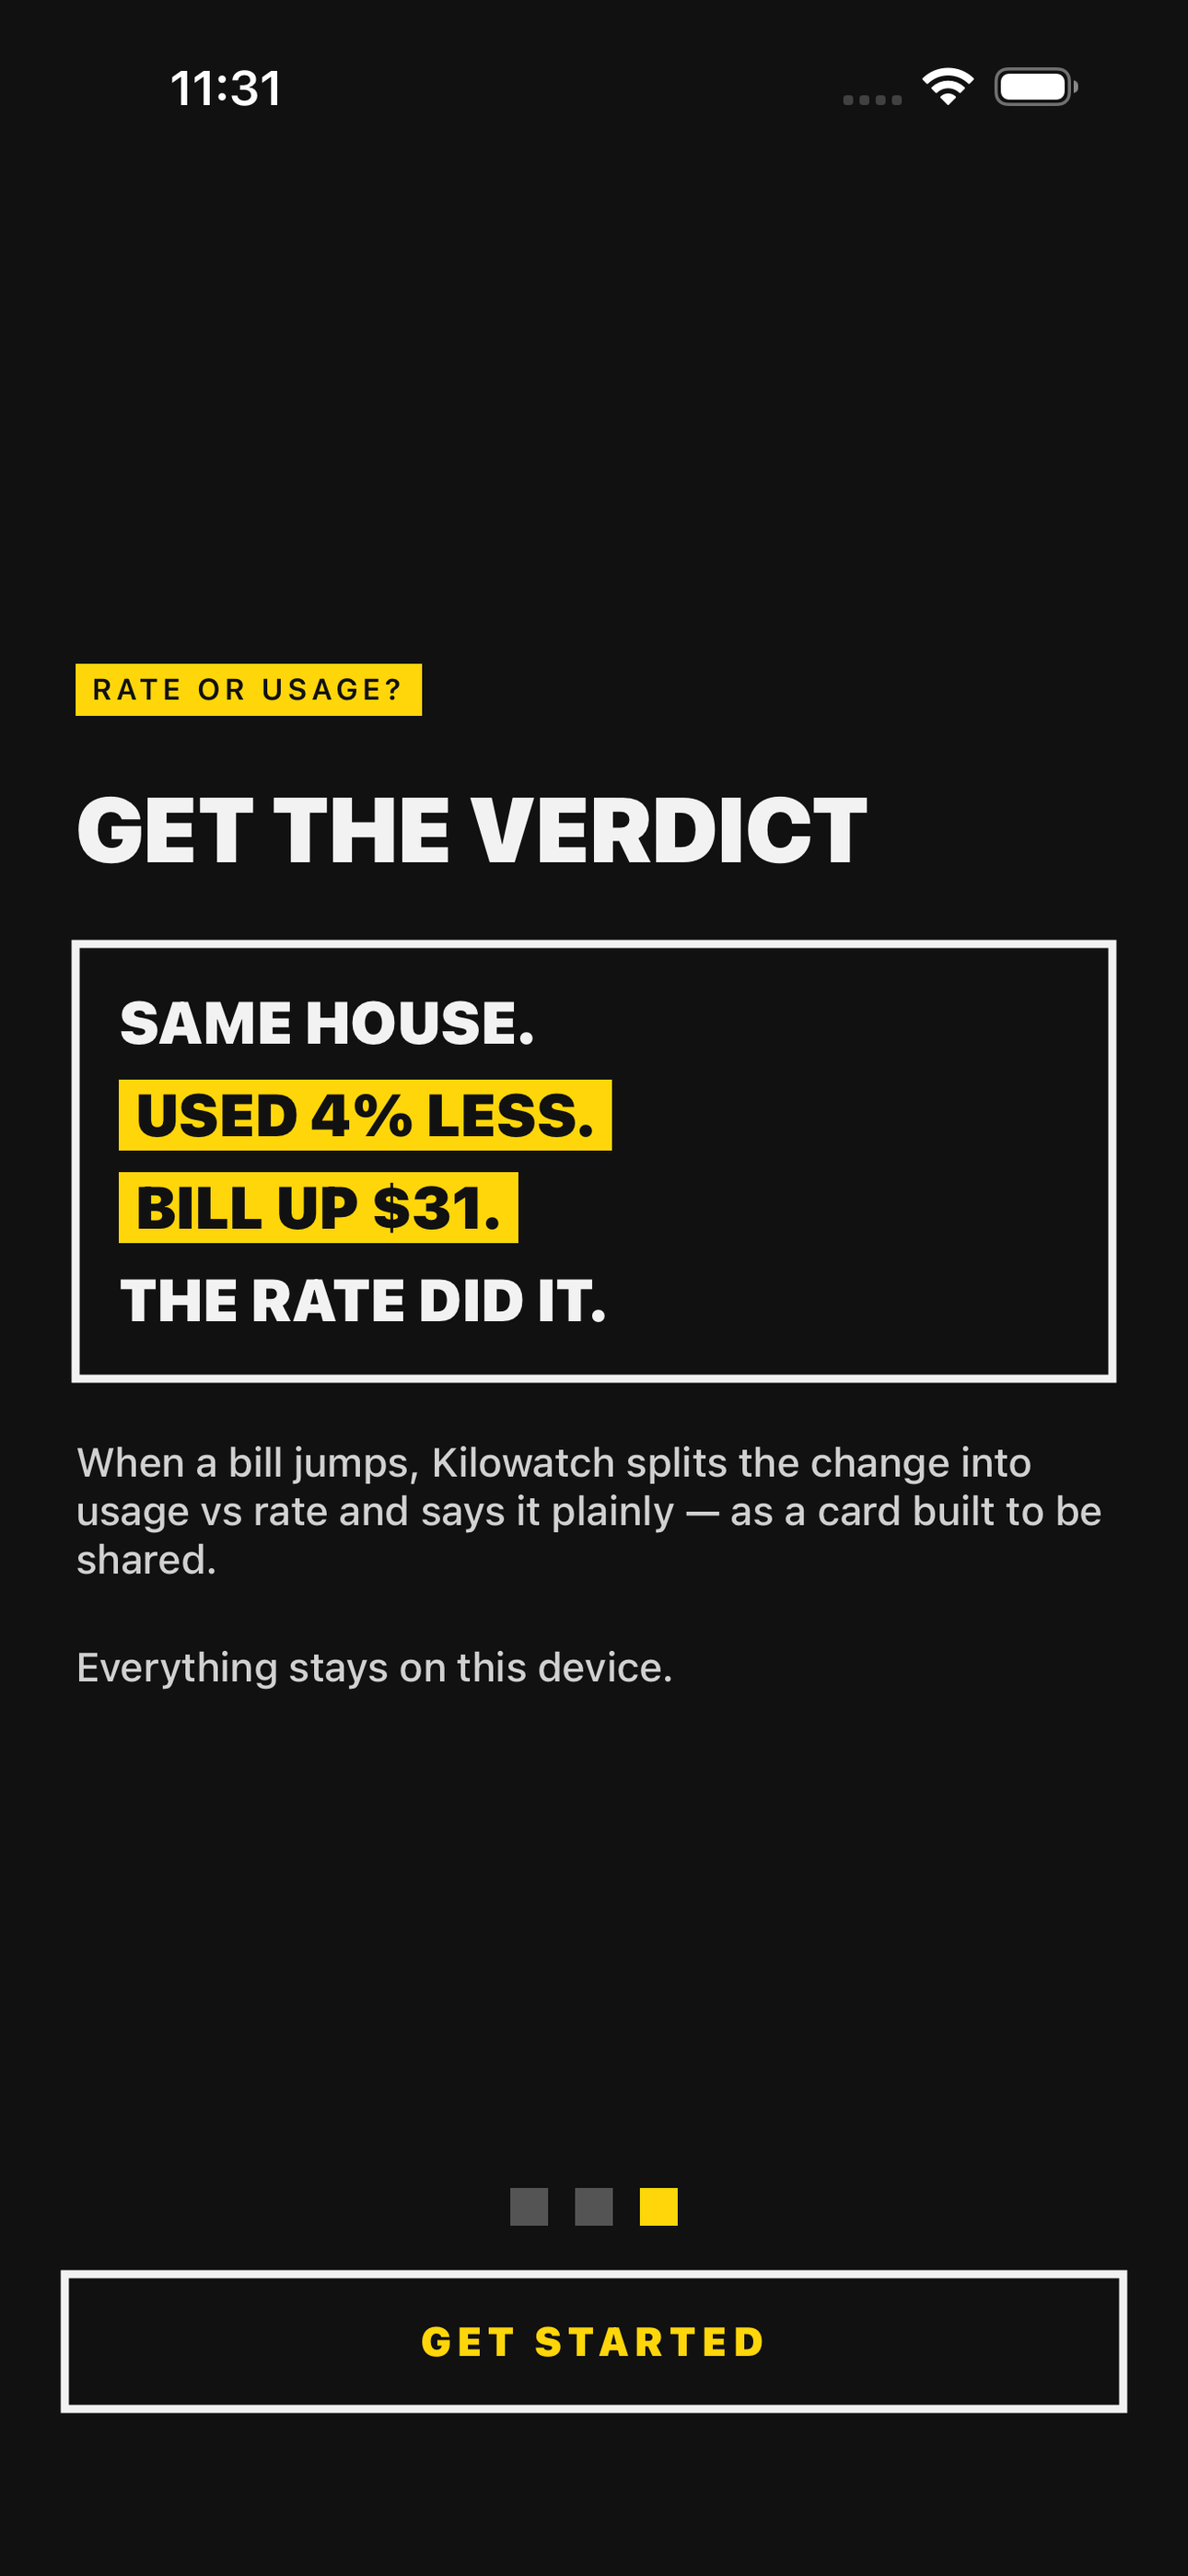
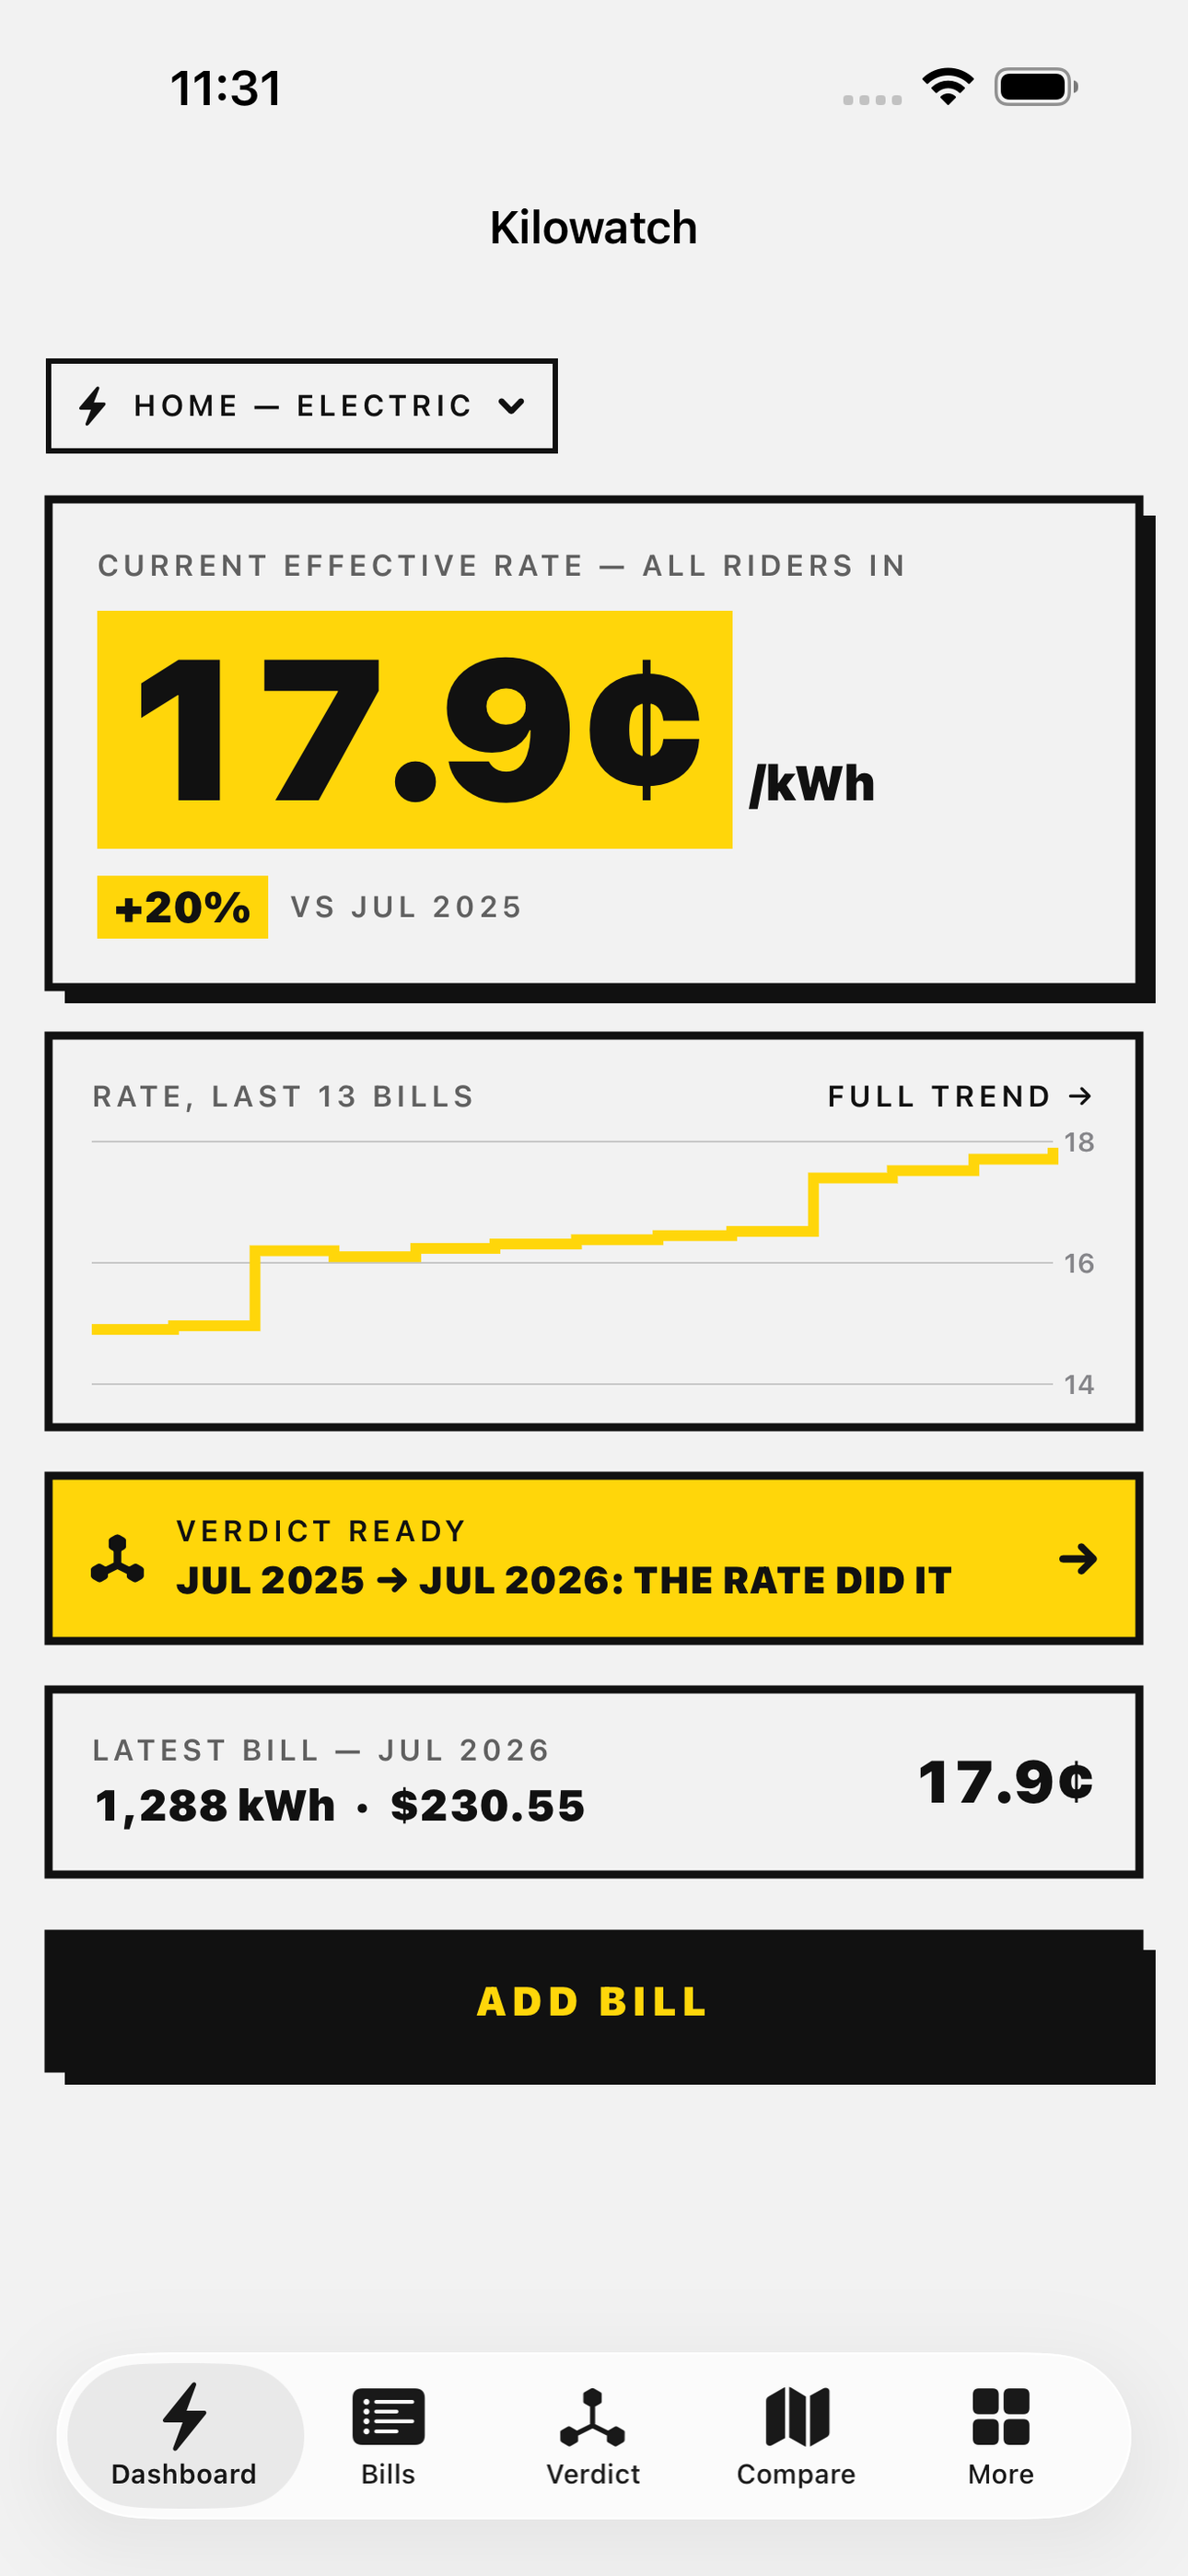
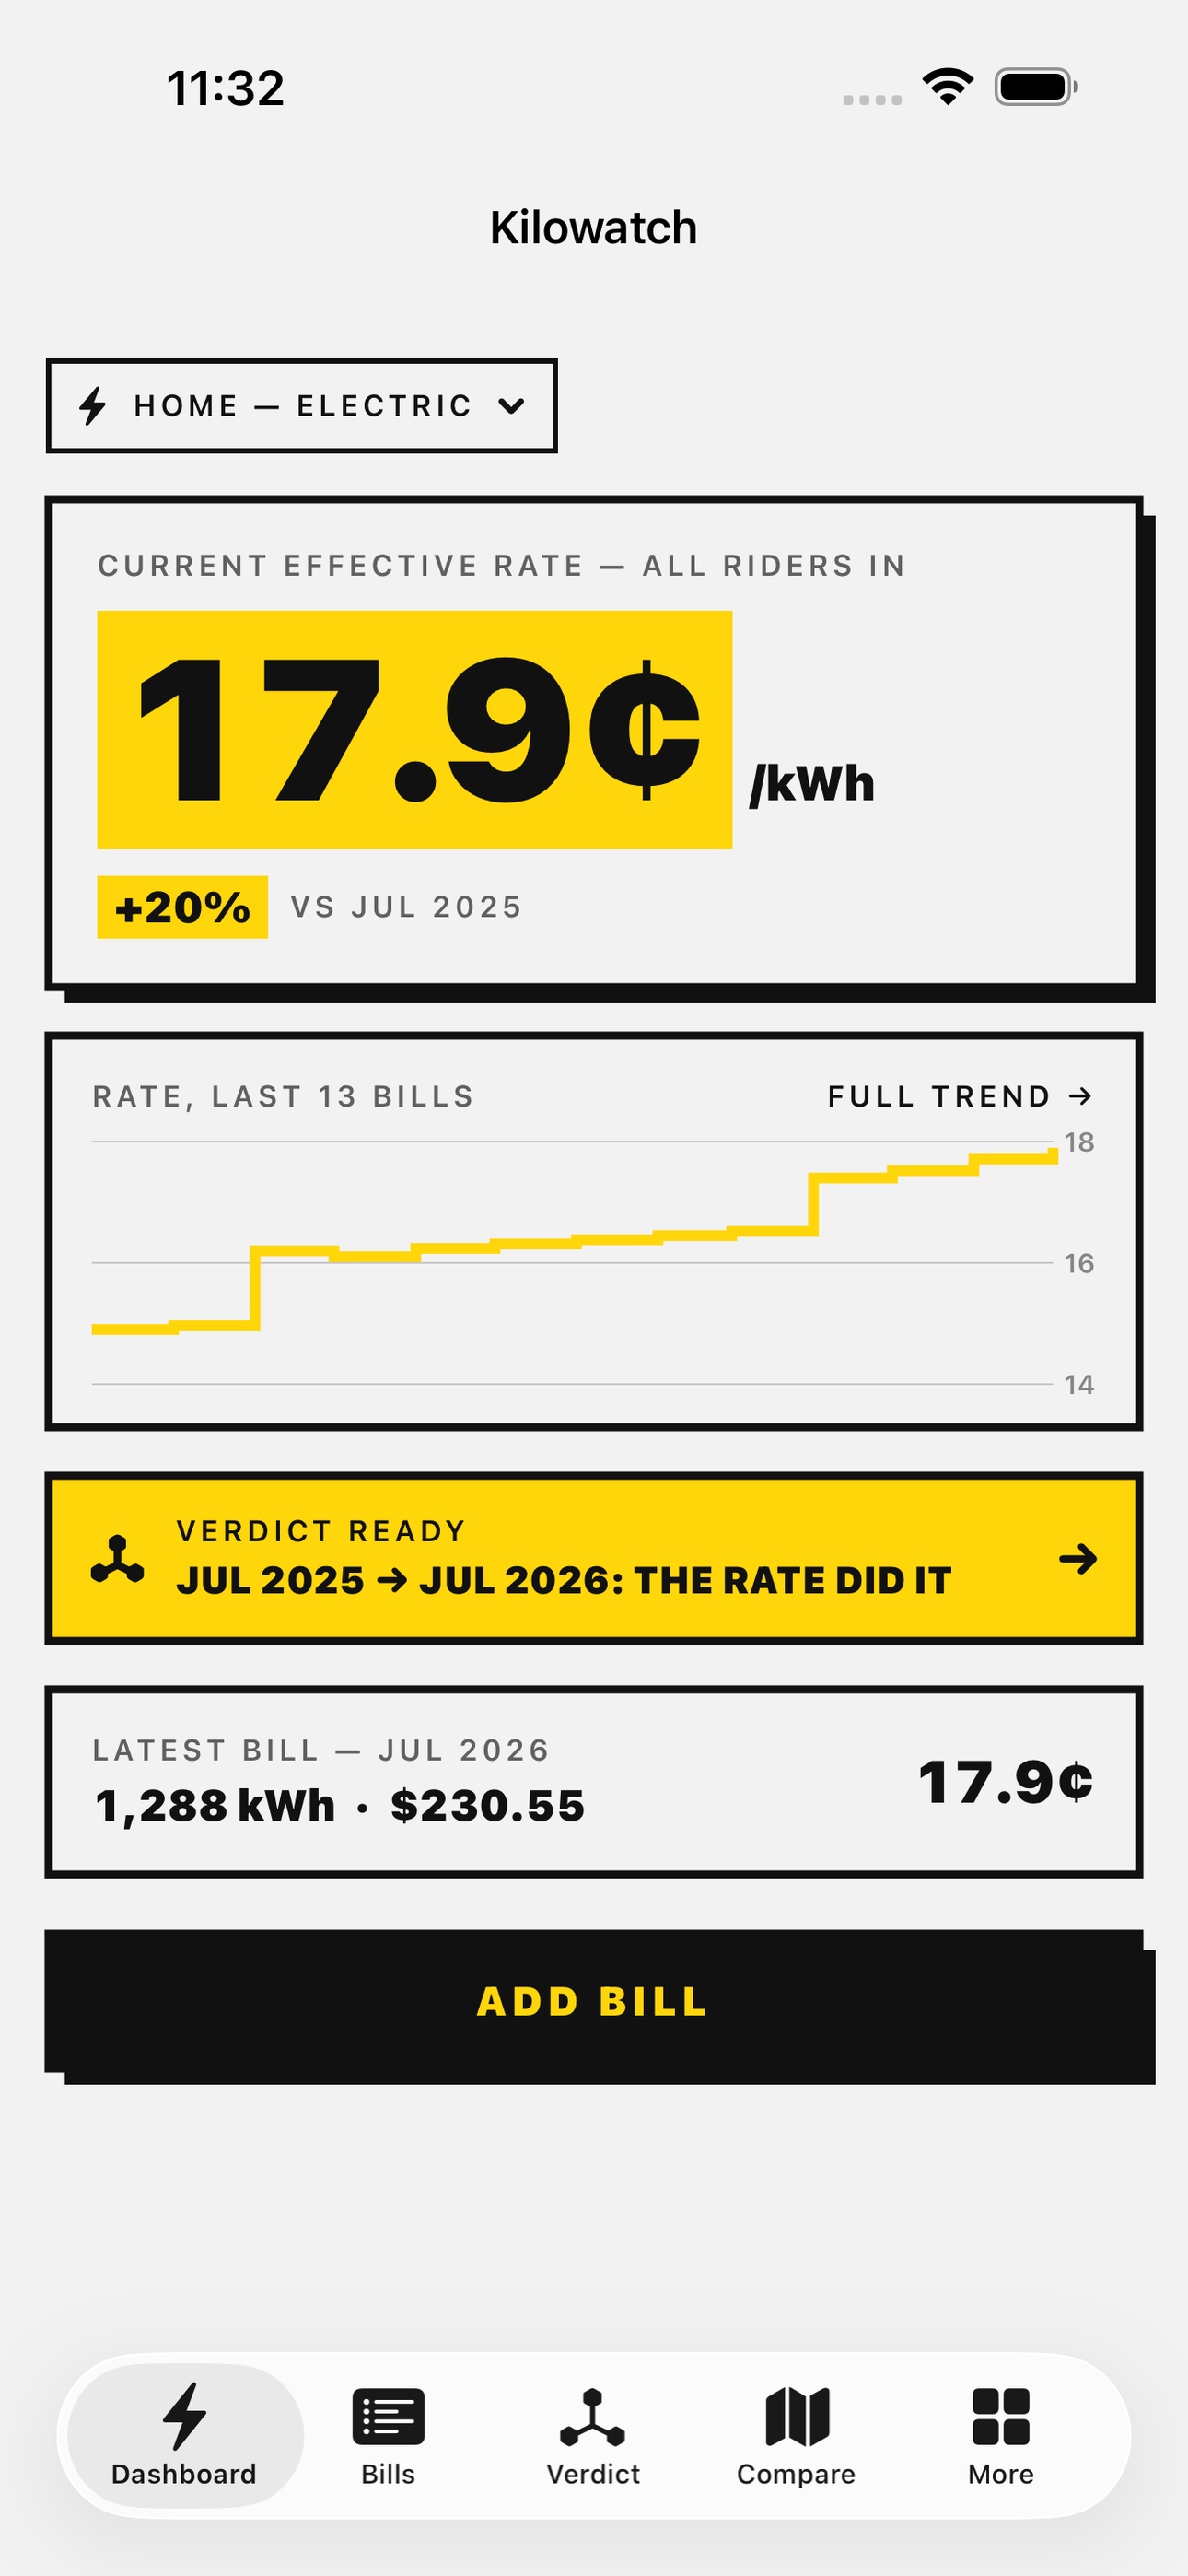
Entering a bill takes ten seconds: type the kWh and the total from the paper or PDF bill. Kilowatch computes your true effective rate — cents per kWh with every rider and delivery charge included — and plots it month over month, year over year. When a bill spikes, the decomposition card splits the change into its two causes and says it plainly: your usage fell 4 percent, your rate rose 22 percent, the rate did it. That card is built to be shared, because a receipt beats a rant.
Electricity prices are up about 40 percent since 2021 — the fastest run-up on record — and utilities requested a record 31 billion dollars in rate hikes in 2025, with billions more filed this year. Your utility's app shows a usage graph, keeps about two years of history, and will never highlight its own rate increases. Kilowatch is the record your utility won't keep: multi-year history that survives moving house, switching providers, or a portal migration that deletes your past.
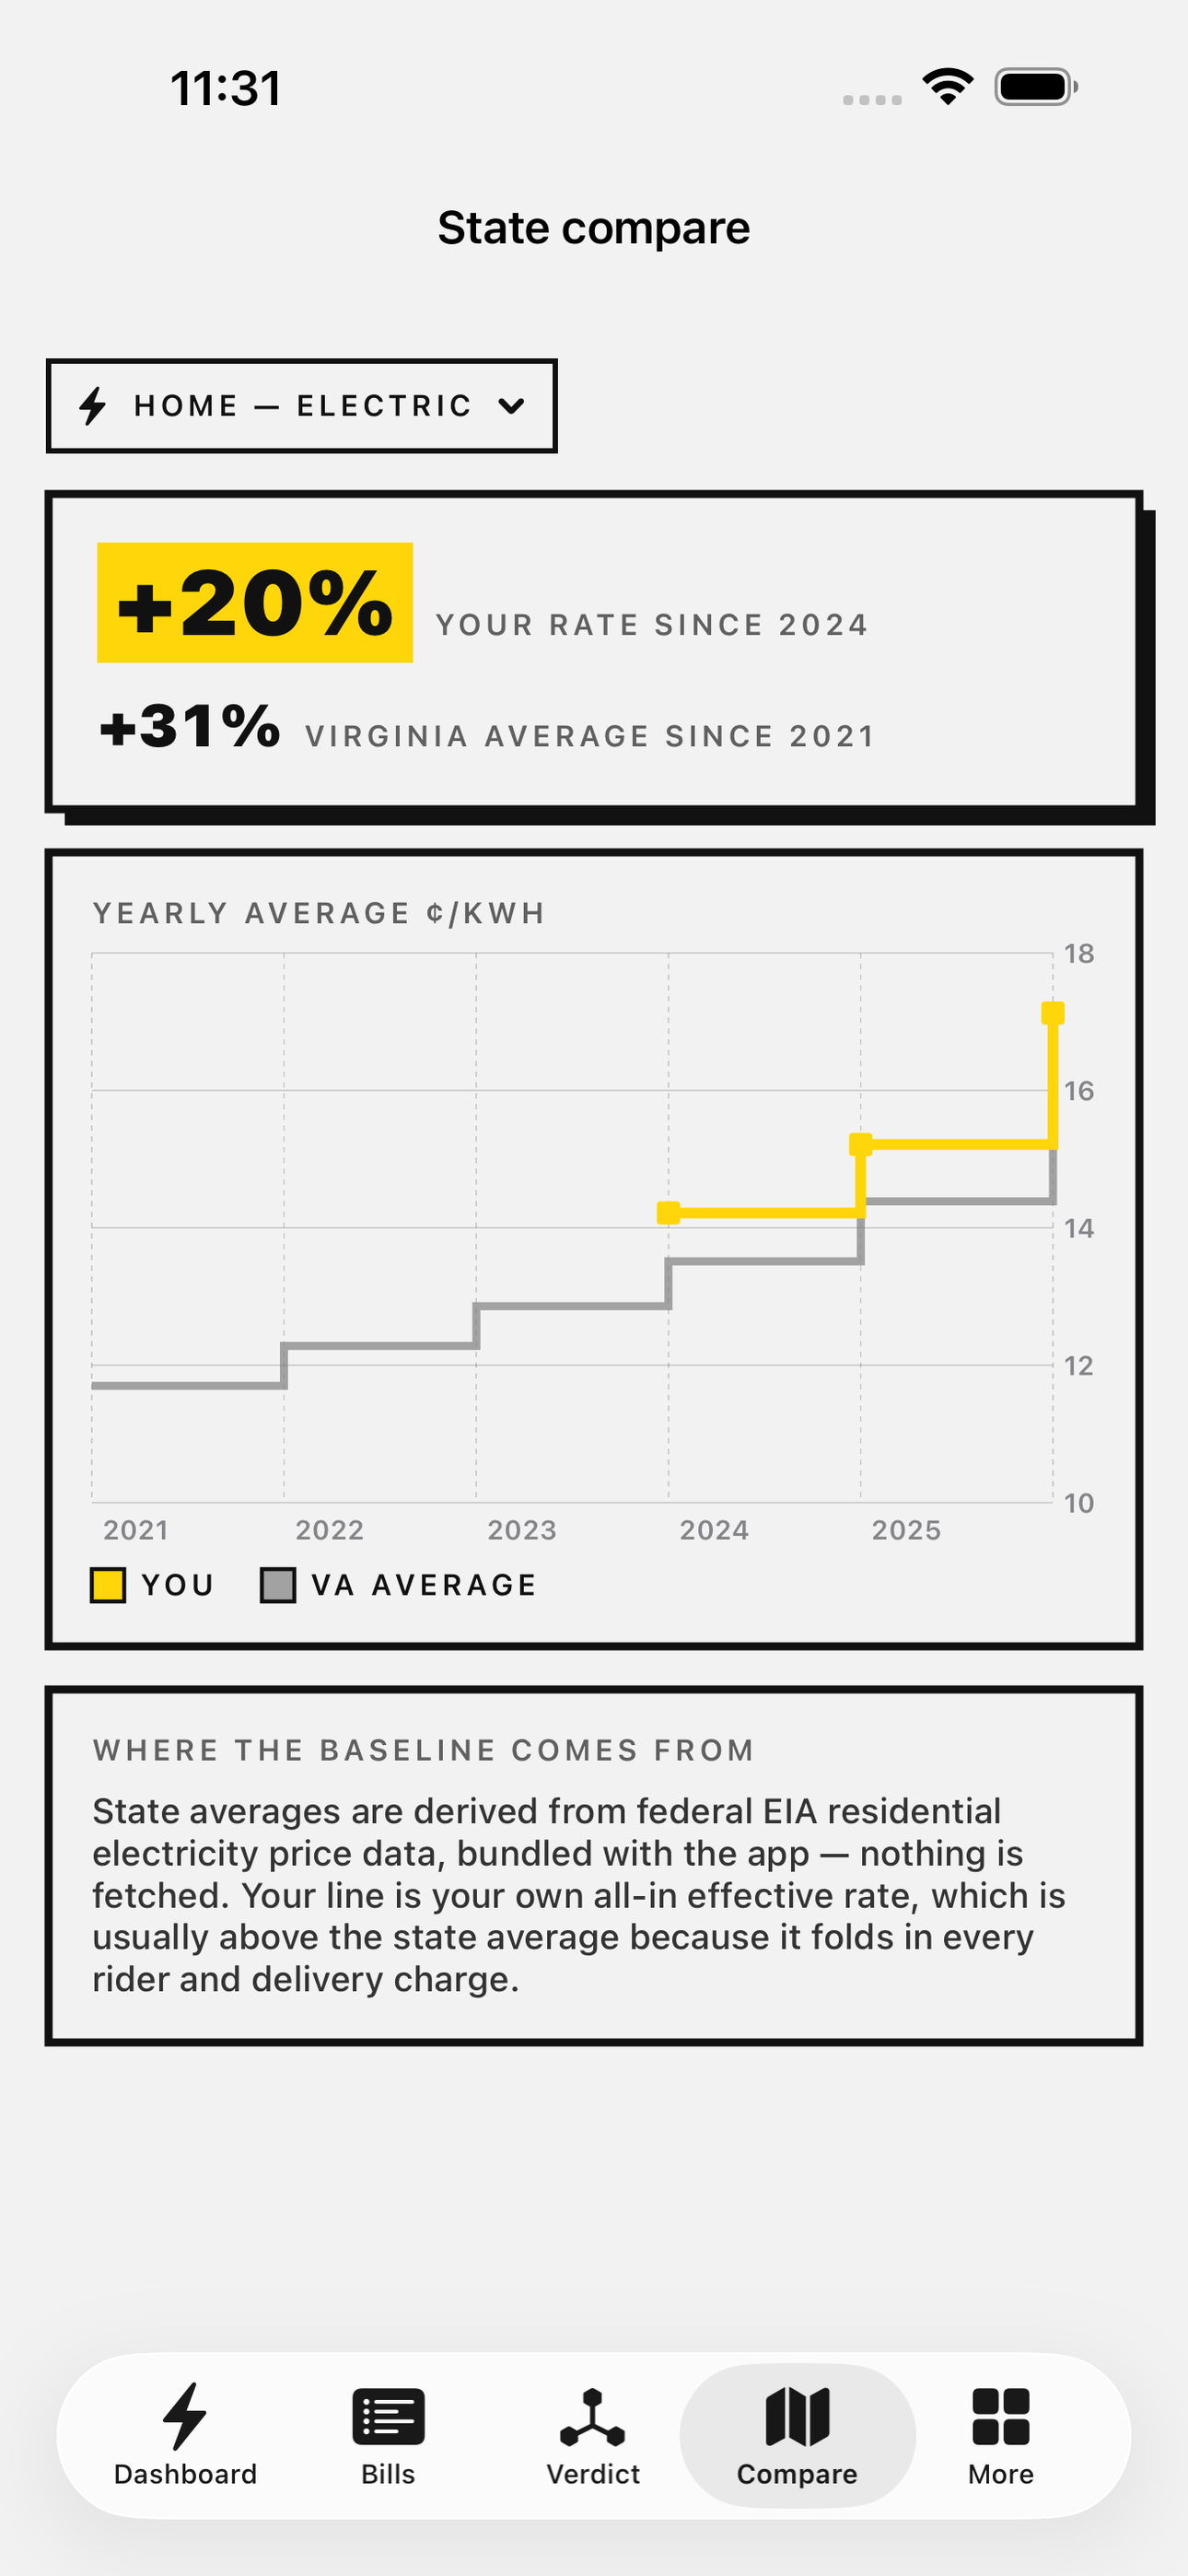
Seasonal normalization compares July to last July instead of to May, so a heat wave never reads as a rate hike and a mild month never hides one. Bundled state baseline data from federal EIA price averages shows whether your rate is climbing faster than your state's. Track gas, water, and propane the same way, and export a clean CSV or PDF for a landlord dispute or a public-utility-commission comment.
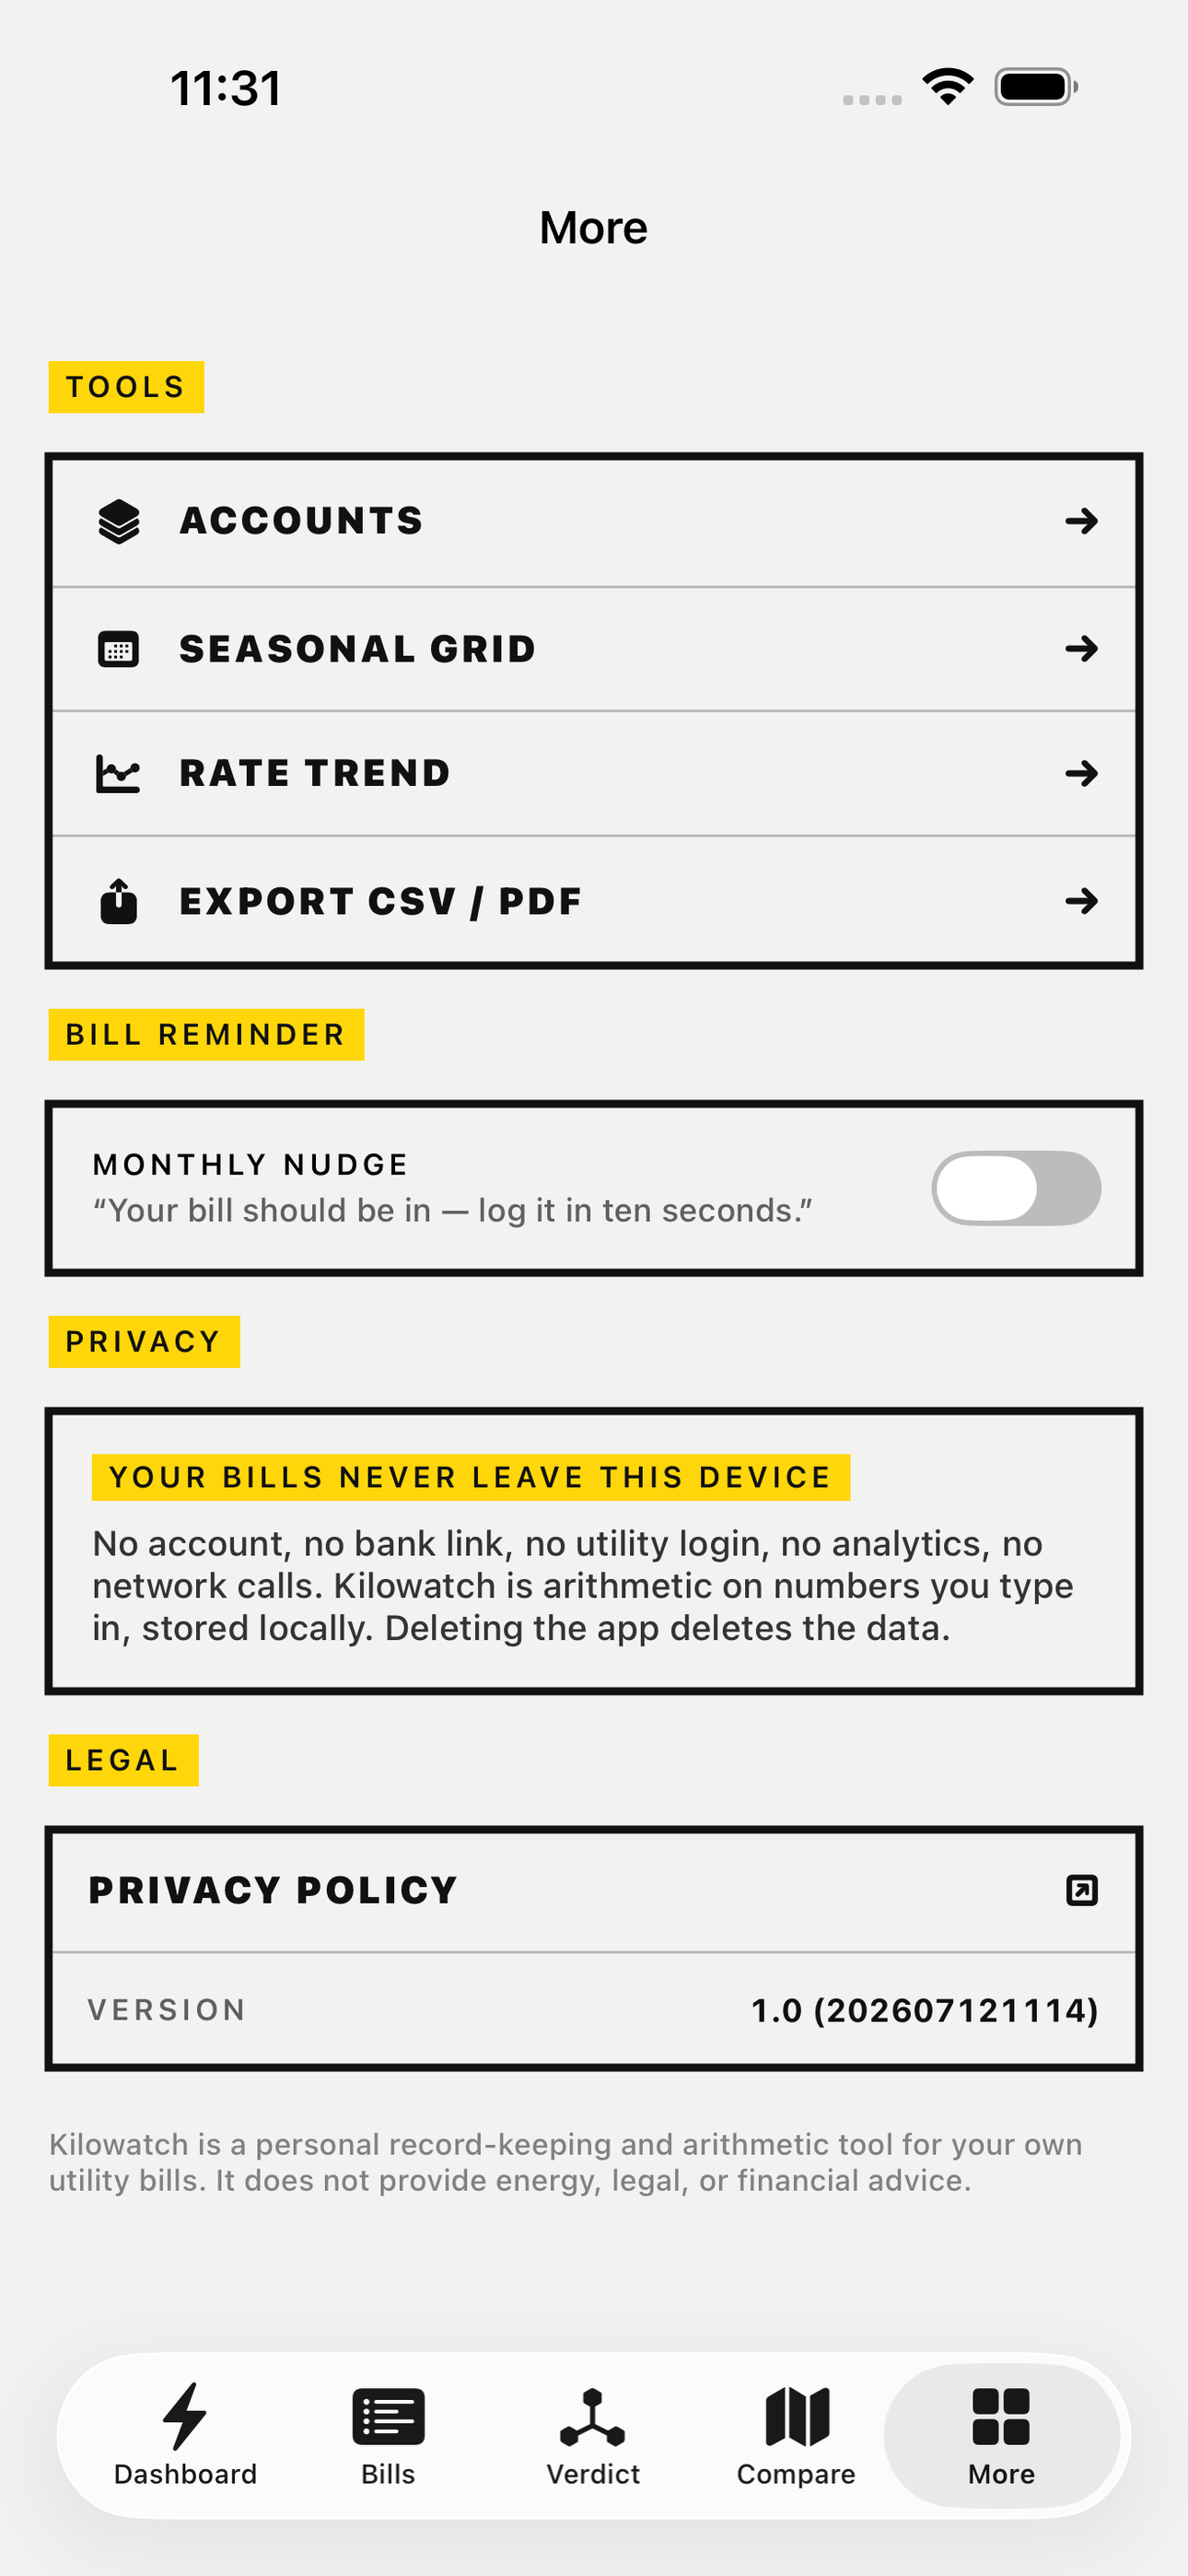
Everything stays on your device. No bank link, no account, no login. Just your bills, your rate, and the plain answer to who raised what.
• Ten-second bill entry: just kWh and total, no bank or utility login • True effective rate in cents per kWh, riders and delivery included • Decomposition card: usage change vs rate change, stated plainly • Multi-year rate and usage charts that survive moving or switching providers • Seasonal normalization so weather never masquerades as a rate hike • State baseline comparison built from bundled EIA price data • Gas, water, and propane accounts tracked the same way • CSV and PDF export for disputes and rate-case comments • Fully offline: no account, no cloud, no data leaves your phone
A look inside
Tap any screenshot to open the full-resolution version.
What's inside
- Ten-Second Bill Log — Type two numbers off each bill — kWh and total — and the bill is logged with its period; a monthly reminder fires on your billing cadence so the log never goes stale.
- Effective Rate Engine — Computes the true all-in cents/kWh (riders and delivery included) for every bill and plots the multi-year rate line beside the usage line, so rate creep is visible at a glance.
- Decomposition Card — For any bill or year-over-year pair, splits the dollar change into usage change vs rate change and renders the verdict as a bold shareable card: 'Same house. Used 4% LESS. Bill up $61. The rate did it.'
- State Baseline — Bundled EIA-derived residential price trends for all 50 states + DC; overlays your effective rate on your state's trajectory to show whether you're being outpaced.
- Seasonal Normalization — Compares each month against the same month in prior years instead of the previous bill, so a July heat wave doesn't read as a rate hike and a mild month doesn't hide one.
- Multi-Utility Accounts & Export — Track gas, water, and propane accounts alongside electric, and export any account's full history as CSV or PDF for landlord disputes or rate-case comments.
Why we built it
Residential electricity prices are up ~40% since 2021 with a record $31B of rate hikes requested in 2025, but when a bill jumps, households can't tell whether THEY used more or the RATE went up: bills bury the effective rate in riders and delivery charges, and utility apps only show usage, keep ~24 months, and will ne…
What makes it different
Utility company apps (Duke, PG&E, ConEd) show kWh usage but obscure the all-in effective rate, keep ~24 months, serve one utility, and are structurally disincentivized from surfacing their own rate hikes; Kilowatch is provider-independent, multi-year, and exists to surface exactly that. Sense and Emporia are $100-300…
Who it's for
Freelancers, contractors, and small-business owners who want their numbers right at tax time without renting a SaaS to do it.
In one line: Rate hike or usage? Know.
Try it
See the Rate hike or usage? Know for the full feature list, the info table, and support links.
Use Kilowatch, found a bug, or have a feature request? Comments are open below — anonymous is fine.
0 comments
No comments yet — be the first.
Leave a reply
Sign in with Google to join the conversation. We require a quick sign-in to keep comments spam-free.
Sign in with Google to comment