
Web app · Health And Fitness
TroughMap
Find the day your GLP-1 shot wears off — before the food noise does
Rate hunger and food noise once a day and TroughMap anchors every entry to Day 1–7 of your injection week, then builds the heat strip and weekly curve that name your personal wear-off day. Free, offline, no sign-up.
Stored in your browser only. Nothing you do in the web version is sent to our servers. Clear your browser data and it's gone — so export a backup from the in-app menu if you want to keep it.
This app is a community proposal.
Try the full browser version now. We build the iPhone and Android app once 100 people upvote it.
We'll email you once, when it ships. Unsubscribe anytime.
In your browser
What you can do in TroughMap on the web
Five seconds a day
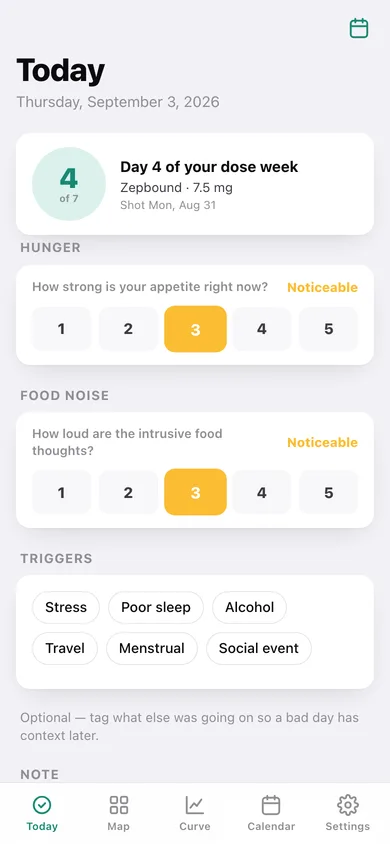
Two 1-to-5 ratings — hunger and food noise — plus optional trigger tags and a note. No weighing, no calorie math, no streak to babysit.
Anchored to your shot, not the calendar
Every check-in snaps to the cycle that started on your most recent injection, so moving your shot day, skipping a week or titrating up re-aligns the whole map without losing history.
The wear-off heat strip
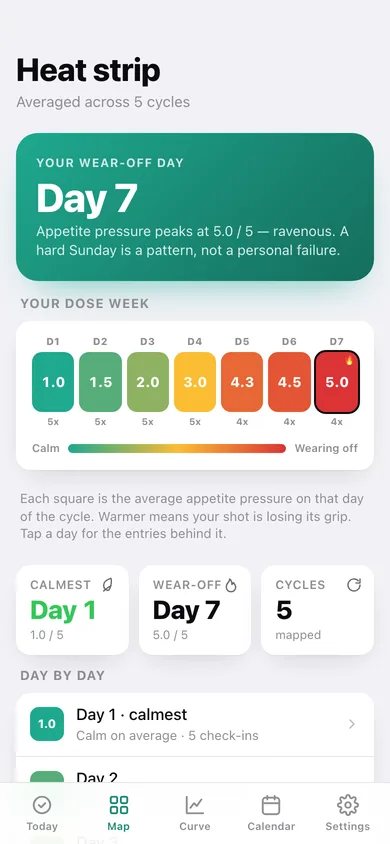
Seven squares, one per day of the dose week, coloured from calm teal to wearing-off red and averaged across every cycle you have logged. The peak is your trough day.
Weekly appetite curve
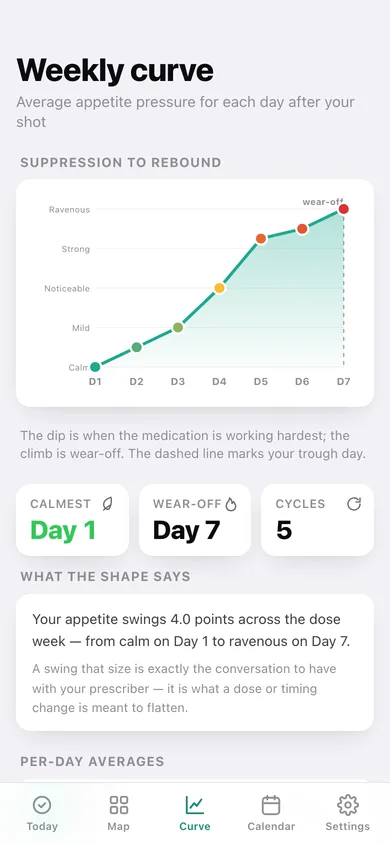
Your suppression-to-rebound arc plotted Day 1 to Day 7 with the wear-off day marked, and the size of your weekly swing spelled out for your prescriber conversation.
Injection calendar
A month grid marking every shot and colouring every check-in by appetite pressure, with the full injection history and dose in one list.
Private health data stays private
No sign-up, no email, no cloud sync. Export your check-ins as CSV — with cycle day, dose and tags — to take to your next appointment.
Screens
Every screen, rebuilt for the browser
-
1
Today
Where you are in the dose week, today's hunger and food-noise ratings, trigger tags and your map so far.
-
2
Heat strip
Your wear-off day named, the seven-square map of the dose week and the day-by-day averages.
-
3
Cycle day
Every check-in that landed on one day of the dose week, its average hunger and food noise and the tags you used.
-
4
Weekly curve
Average appetite pressure for each day after your shot, with the wear-off line and how big your weekly swing is.
-
5
Calendar
Month grid of injections and colour-coded check-ins plus your full shot history.
-
6
Injection
Log or edit a shot — date, medication, dose in mg and a titration note.
-
7
Settings
Rating scale, CSV export for your prescriber, JSON backup, sample data and erase.
Try it with sample data: Loads five weekly Zepbound injections — 5 mg titrated up to 7.5 mg three weeks in — with a daily check-in for every day since the first shot, producing a calm Day 1–3 and a wear-off peak late in the week. You can start fresh at any time.
Ready? It's free.
No account, no install, no subscription. Everything you do stays in this browser.
Your say
What should TroughMap do? Tell us before we build it.
Tell us what to build next.
Comments need a free Google sign-in, so every one is from a real person.
Sign in with Google to commentNo comments yet — be the first to say what this app should do next.
Questions
Is the web version of TroughMap free?+
Yes. Every screen is free to use: no subscription, no in-app purchases, no account.
Do I need an account?+
No. Open TroughMap and start using it right away. Sign in with Google only if you want to upvote an app, save it to your list, or leave a comment.
Where is my data stored?+
Only in this browser's local storage. Nothing you enter is sent to our servers, so we can't see it, back it up, or restore it. Clearing site data, a private window, or another device starts empty. Export a backup from the in-app menu to keep it.
Is there a TroughMap app for iPhone or Android?+
Not yet. TroughMap is a community proposal: the browser version is complete, and we build the iPhone and Android app once 100 people upvote it. Upvoters get one email when it ships.