
Web app · News
Geomonitor
A private watchlist for the geopolitical events markets actually price
Conflicts, elections, regulatory milestones, energy shocks. Log your own implied probability, watch the line move, keep your reasoning private. Thirty hand-picked starters included. It is the journal, not the terminal — no prices are fetched. Free, no install.
Stored in your browser only. Nothing you do in the web version is sent to our servers. Clear your browser data and it's gone — so export a backup from the in-app menu if you want to keep it.
This app is a community proposal.
Try the full browser version now. We build the iPhone and Android app once 100 people upvote it.
We'll email you once, when it ships. Unsubscribe anytime.
In your browser
What you can do in Geomonitor on the web
Thirty hand-picked starters
The full starter pack from the iPhone app — Russia-Ukraine, Taiwan, Saudi-Israel normalisation, OPEC+, Sahel peacekeeping, crude above $100 and 24 more — grouped by region, added one at a time or all at once.
Your number, not a market's
Set the implied probability on a 0–100 slider with quick 5 / 10 / 25 / 50 / 75 / 90 taps, and Geomonitor labels it: long shot, unlikely, toss-up, likely, near lock.
Every reading is kept
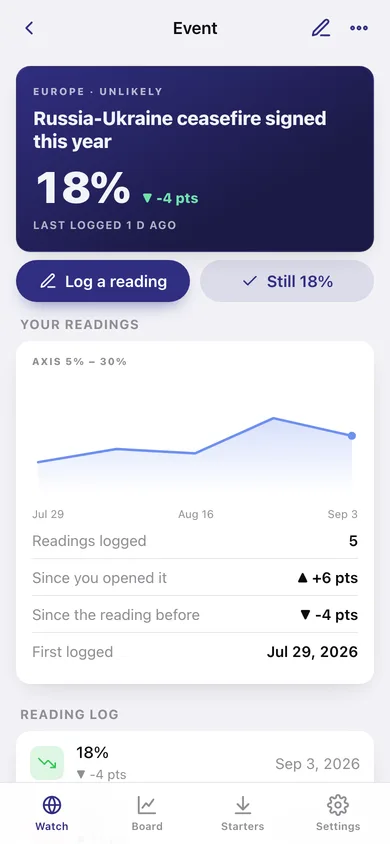
Each time you log a number it joins that event's history, so the detail screen draws the line and tells you the move since the previous reading and since you opened the position.
Staleness is the nag
A number you logged six weeks ago is worse than none. Geomonitor counts the days since your last check, flags stale events at your own threshold and lists what is due.
The board
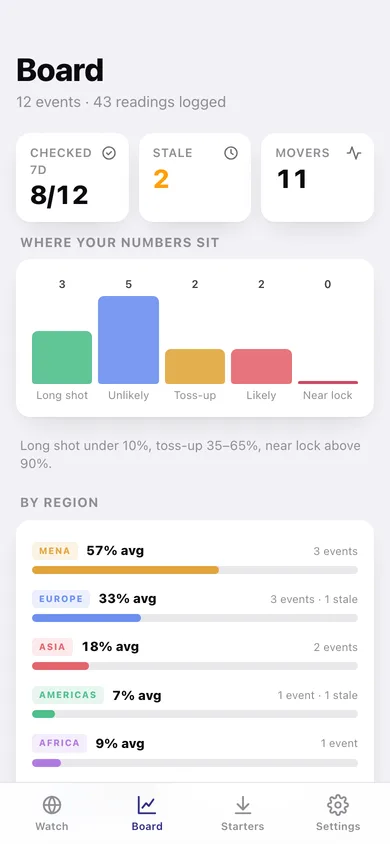
How your watchlist is distributed across the probability bands, the average by region, the biggest movers, the highest numbers on your board and everything due a check.
Private by construction
No account, no network, no price feed. Export the whole watchlist as JSON or a CSV of your latest numbers whenever you want it elsewhere.
Screens
Every screen, rebuilt for the browser
-
1
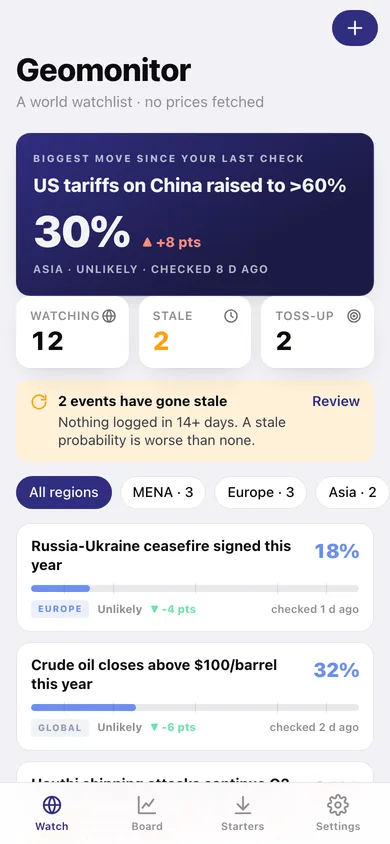
Watch
The biggest move since your last check, staleness counts, region filters and every event with its probability gauge.
-
2
Event
One event: your number, the reading history as a line, the move since last, the full reading log and your private notes.
-
3
New event
Title, region, the probability slider and notes, plus the band table the app reads numbers with.
-
4
Board
Distribution across the bands, average probability by region, biggest movers and everything due a check.
-
5
Starter pack
All thirty hand-picked events grouped by region, showing which are already on your watchlist.
-
6
Settings
The staleness threshold, the band table, bulk check-in and export / sample / erase.
Try it with sample data: Loads twelve live events across five regions — Ukraine, Taiwan, Saudi-Israel, crude above $100, EU AI rules, OPEC+ and more — each with three to five readings spread over about six weeks, real notes, and two events deliberately left stale. You can start fresh at any time.
Ready? It's free.
No account, no install, no subscription. Everything you do stays in this browser.
Your say
What should Geomonitor do? Tell us before we build it.
Tell us what to build next.
Comments need a free Google sign-in, so every one is from a real person.
Sign in with Google to commentNo comments yet — be the first to say what this app should do next.
Questions
Is the web version of Geomonitor free?+
Yes. Every screen is free to use: no subscription, no in-app purchases, no account.
Do I need an account?+
No. Open Geomonitor and start using it right away. Sign in with Google only if you want to upvote an app, save it to your list, or leave a comment.
Where is my data stored?+
Only in this browser's local storage. Nothing you enter is sent to our servers, so we can't see it, back it up, or restore it. Clearing site data, a private window, or another device starts empty. Export a backup from the in-app menu to keep it.
Is there a Geomonitor app for iPhone or Android?+
Not yet. Geomonitor is a community proposal: the browser version is complete, and we build the iPhone and Android app once 100 people upvote it. Upvoters get one email when it ships.